An Aging Clock Based on Immune Repertoire Features: COVID-19 Accelerates Aging.
Aging induces immunosenescence, a progressive decline in immune function underpinning age-related pathogen vulnerability, yet T/B cell receptor (TCR/BCR) repertoire remodeling during aging remains incompletely characterized, especially in non-European populations. Additionally, SARS-CoV-2 may perturb immune homeostasis and accelerate aging, but its impact on immune repertoire aging is unclear. Here, we analyzed leukocyte DNA from 195 healthy Chinese individuals (25-93 years) and 94 post-COVID-19 cases via CDR3 high-throughput sequencing. Aging correlated with shorter CDR3 sequences, reduced VDJ gene/V-J combination diversity, declining TCR/BCR clonotype counts (179.7/507 per 3 years), expanded hyperexpanded TCR/large BCR clones, and reduced diversity (critical turning point ~60 years). These changes were intensified post-COVID-19, with altered amino acid usage, diminished diversity, and expanded SARS-CoV-2/Mycobacterium tuberculosis-related clones. We developed a LightGBM-based immune repertoire aging clock, validating accelerated biological aging (increased cAgeDiff) and reduced intrinsic capacity in post-COVID-19 individuals. Our findings reveal age-dependent immune repertoire remodeling exacerbated by COVID-19, deepening understanding of immunosenescence and post-viral dysfunction, with potential clinical applications for age-related immune decline and post-COVID-19 syndromes.
Background
The immune system is a complex and dynamic network with crucial roles in maintaining physiological health and protection from various pathogens (Nikolich‐Žugich2018). The immune repertoire, which includes highly diverse T cell receptors (TCRs) and B cell receptors (BCRs), is central to adaptive immune responses (Wu et al.2021). TCRs and BCRs recognize and bind to specific antigens, thereby triggering an immune reaction (Parker1993), and the ability of the immune system to respond effectively to a wide array of antigens is directly related to TCR and BCR repertoire diversity and functionality (Wu et al.2021). At the genetic level, the diversity of TCRs and BCRs is generated through the V(D)J recombination process, which involves rearrangement of variable (V), diversity (D), and joining (J) gene segments. In the case of TCRs and BCRs, different combinations of these gene segments come together to form a unique receptor sequence (Lebedin and de la Rosa2024). The complementary determining region 3 (CDR3) is located at the junctions of the V, D, and J gene segments in the TCRβ and BCR heavy chains and at the V‐J junction in TCRα and BCR light chains, and is particularly important in determining BCR and TCR diversity (Lebedin and de la Rosa2024). The randomness of the V(D)J recombination process, along with the addition and deletion of nucleotides at junctions during this recombination, leads to an extremely high level of diversity in the CDR3 region, which contributes significantly to the overall diversity of TCRs and BCRs, enabling the immune system to recognize a vast number of different antigens.
In recent years, the emergence of high‐throughput sequencing (HTS) technologies has revolutionized the field of immunology by enabling comprehensive analysis of the immune repertoire. HTS allows detailed characterization of TCR and BCR sequences, providing insights into immune response diversity, clonality, and antigen specificity. The widespread application of immune repertoire sequencing has greatly advanced research into, and application of, the immune repertoire in various medical fields, including aging (Martin et al.2015), infectious diseases (Zheng et al.2022), autoimmune diseases (Ma et al.2019), and oncology (Ye et al.2018). Immune repertoire analysis can reveal the dynamic changes in the immune system during disease onset and progression, providing new perspectives for early diagnosis, treatment, and prognosis evaluation.
With increased aging of the global population, the impact of aging on the immune system has become a subject of great interest and concern. Aging is associated with a decline in immune function, a phenomenon known as immunosenescence (Brauning et al.2022), which is accompanied by changes in the immune repertoire, such as reduced TCR and BCR diversity. For example, TCR repertoire diversity drops significantly with age, which may affect the ability of the immune system to respond to new antigens (Martin et al.2015); however, existing knowledge in this field has several limitations. Understanding the changes that occur in the immune repertoire during aging is essential for developing strategies to enhance the immune response in older adults and improve their overall health.
Most previous studies have focused on populations of European descent, and knowledge of the immune repertoire in healthy individuals of different ages, especially in the Chinese population, remains limited (Song et al.2022). Given the unique genetic and environmental factors that may influence the immune system in different populations, studies specifically focused on the Chinese population are necessary to gain a more comprehensive understanding of age‐related changes in the immune repertoire. Additionally, while the impact of aging on the immune repertoire is becoming clearer, the mechanisms underlying these changes are not fully understood. Factors such as genetic background, environmental exposures, and epigenetic modifications may all contribute to alterations in the immune repertoire during aging, but their relative contributions and interactions remain unclear. Here, by systematically characterizing the age‐associated immune repertoire remodeling features in a large cohort of healthy Chinese individuals with distinct genetic background and living environmental characteristics, we establish a comprehensive baseline dataset of immune repertoire aging in non‐European populations, which provides a critical foundation for subsequent studies to disentangle the relative contributions of these multi‐factorial regulators.
In the wake of the Severe Acute Respiratory Syndrome Coronavirus 2 (SARS‐CoV‐2) pandemic, an additional layer of complexity has been added to study of the immune system. Coronavirus Disease 2019 (COVID‐19) senescence, caused by SARS‐CoV‐2, has not only presented a formidable global health crisis but has also had a significant impact on human immune systems (Hu et al.2021). COVID‐19 can lead to alterations in immune function (Diao et al.2020; Tan et al.2020), and there is evidence that it may even accelerate the aging process through mechanisms such as changes in DNA methylation levels (Cao et al.2022). These findings emphasize the need to explore the intersection between aging and COVID‐19 in relation to the immune repertoire.
Most age‐related TCR/BCR studies focus on European populations; consistent aging patterns remain unclear, especially for BCR and TCR/BCR differences. Chinese population studies are small and lack full‐age baseline data (Song et al.2022). Most COVID‐19 repertoire studies are cross‐sectional and limited to acute responses, without paired samples or links to immunosenescence, long‐term health, or age‐dependent mechanisms. No quantitative model exists for immune repertoire‐based biological age assessment. We analyzed TCR/BCR repertoires in healthy Chinese and paired pre/post‐COVID‐19 individuals, characterized aging‐ and infection‐induced remodeling, and built an immune repertoire aging clock. This work fills non‐European population gaps, reveals COVID‐19‐driven accelerated immunosenescence, and provides insights for age‐related immune decline and long COVID interventions.
Methods
Study Participants and Cohorts
This study included 195 healthy volunteers aged between 25 and 93 years from two sources: the “PENGZU cohort” (n= 123), recruited at Beijing Hospital between November 2019 and February 2020, and the “CMUCH cohort” (n= 72), recruited at Beijing Chest Hospital from November 2019 to October 2020. The inclusion criteria for volunteers were as follows: normal white blood cell count and ultrasensitive C‐reactive protein level within the normal range; no history of any form of tumor, with relevant tumor markers, such as carcinoembryonic antigen and alpha‐fetoprotein, at normal levels; no recent occurrence of diseases including acute cerebral infarction or acute myocardial infarction; not in any form of trauma period or postoperative recovery period; no history of any autoimmune disease; not currently undergoing any form of anti‐inflammatory or anti‐allergic treatment; and no physical or mental function problems that would prevent them from completing the study. The eligibility of all volunteers was confirmed and potential confounding factors related to underlying health conditions excluded.
This study was approved by the Ethics Committee of Beijing Hospital (Approval No. 2019 BJYYEC‐054‐02), and all volunteers signed informed consent forms.
Follow‐Up and Sample Designation
Follow‐up samples were collected between November and December 2022 from participants in the PENGZU cohort who had previously been diagnosed with COVID‐19 (confirmed by SARS‐CoV‐2 antigen or nucleic acid testing). These follow‐up blood samples were collected during the post‐infection period as part of a longitudinal follow‐up, rather than during the acute stage of SARS‐CoV‐2 infection. However, the exact time interval between infection/diagnosis and follow‐up sampling varied among individuals due to real‐world follow‐up conditions. A strict screening process was conducted to exclude the presence of major diseases, such as tumors, acute cerebral infarction, myocardial infarction, and autoimmune disease. Ultimately, 94 individuals (aged 30–86 years) were successfully followed up. Samples collected from individuals in the PENGZU cohort at baseline (first sampling) and after COVID‐19 were designated as the Pre‐ and Post‐COVID‐19 groups (n= 94 each), respectively.
Grouping for Analysis
For subsequent analysis, PENGZU (all baseline samples) and CMUCH cohort samples were combined into a Healthy group to study the characteristics of immune repertoire changes during aging, and the Post‐COVID‐19 group from the PENGZU cohort was used to study the characteristics of immune repertoire changes after SARS‐CoV‐2 infection. All samples were grouped according to age, as follows: Young (25–44 years), Middle (45–59 years), Aged (60–74 years), and Old (75–93 years). The basic information of all volunteers is presented in Table1.
Table: Basic characteristics of samples included in this study.
Venous Blood Collection
Samples of venous blood (5 mL) were collected using purple vacuum blood collection tubes containing EDTA‐K2 anticoagulant, immediately thoroughly mixed by gentle inversion, and an aliquot used for complete blood count testing. Additionally, 2 mL of venous blood was collected into red vacuum blood collection tubes without additives and used to separate serum, which was reserved for routine blood testing and analyses of biochemical indices and tumor markers, etc.
Leukocyte Isolation Procedure
Leukocyte isolation was commenced within 4 h of blood collection, to preserve cell viability. Anticoagulated blood samples were centrifuged at 815×gfor 10 min at 4°C, then the 1 mL buffy coat layer, rich in leukocytes, was extracted, mixed with 3 mL of red blood cell lysis buffer (Solarbio, China), vortexed gently, and incubated on ice for 15 min to lyse red blood cells while keeping leukocytes intact. After incubation, the mixture was centrifuged again under the same conditions, the supernatant discarded, and 0.5 mL pre‐cooled RPMI 1640 medium (Thermo Fisher Scientific, USA) and 0.5 mL of 20% DMSO cryopreservation solution (Thermo Fisher Scientific, USA) added to the pellet. Cells were resuspended and transferred to cryovials, which were placed in a pre‐cooled controlled‐rate freezing container (Thermo Fisher Scientific, USA). Once frozen, cryovials were stored at −80°C for further use.
Leukocyte DNA Extraction
DNA was extracted from leukocyte samples (350 μL) using a KingFisher automated nucleic acid extraction instrument (Supplier), according to the manufacturer's instructions and collected in Elution Buffer in 1.5 mL tubes. Finally, DNA quantification and quality assessment were carried out to ensure no significant degradation and availability of ≥ 0.4 μg of DNA for sequencing, by checking purity and integrity using spectrophotometry and agarose gel electrophoresis.
Immunorepertoire DNA Library Preparation and Sequencing
The DNA regions encoding CDR3 domains of the T cell receptor beta (TRB) and immunoglobulin heavy (IGH) chains were amplified by multiplex PCR using primers designed within conserved regions of the V and J genes that flank the regions encoding the CDR3 regions of BCRs and TCRs. This design allowed for specific amplification of the CDR3 region, which was then utilized as the foundation for the construction of high‐throughput sequencing libraries.
Subsequently, amplified single‐stranded circular DNA was transformed into DNA nanoballs (DNBs) by rolling circle replication. Each DNB contained multiple copies of the DNA sequence, enhancing the signal strength for accurate detection. DNBs were then loaded into the microwells of a high‐density DNA nanochip. High‐throughput sequencing of each DNB on the chip was conducted using combinatorial probe‐anchor synthesis on the BGI BGISEQ‐500 sequencing platform.
Sequencing Data Processing
Raw sequencing data were processed with SOAPnuke v1.5.6 for adapter trimming and low‐quality read filtering. Clean reads were analyzed by MiXCR v3.0.13 for alignment, CDR3 extraction, and error correction. Core clones were defined by quality‐filtered sequences; low‐frequency and single‐base variants were clustered and merged. Final clones were realigned to V/D/J references to generate clonal profiles for downstream analysis.
Abundance Calculations
We calculated absolute and relative abundances of V/D/J, V–J, CDR3 nucleotide sequence (CDR3nt), and CDR3 amino acid sequence (CDR3aa) from filtered clone data. Absolute abundance reflects total counts of identical sequences; relative abundance was obtained by normalization to total counts within each sample. This approach enabled robust comparisons of clonal expansion, diversity, and effects of aging and COVID‐19 on the immune repertoire.
To minimize bias from sequencing depth variation, all libraries were prepared and sequenced using standardized procedures and identical sequencing parameters. Raw reads were processed using the same quality‐control and clonotype‐calling pipeline (SOAPnuke and MiXCR) across all samples. For downstream analyses, clonotype and gene usage abundances were normalized as relative frequencies within each sample. Sequencing saturation analysis further confirmed sufficient depth for repertoire quantification (FigureS1A,B).
CDR3 Structural Analysis
Structural analysis of CDR3 was conducted by assessment of CDR3nt and CDR3aa sequence lengths, as well as of usage rates of the 20 amino acids. CDR3aa length and hydrophobicity are generally considered to be related to immune responses (Ritmahan et al.2020). Based on data from the IMGT database (https://www.imgt.org), the 20 amino acids in CDR3 were classified into three categories according to their properties: hydrophilic, hydrophobic, and neutral.
Clonal Size Analysis
Clonal size was visualized using the WeightedTreemaps package (version 0.1.1) in R. Clones were classified into five categories (Rare, Small, Medium, Large, Hyperexpanded) via the immunarch package (version 0.8.0) with default homeo parameters, enabling in‐depth analysis of clonal expansion patterns.
Clonal Diversity Analysis
The diversity index of the immune repertoire serves as a quantitative gauge of the variety of immune cell receptors (e.g., TCRs or BCRs) within an individual's immune system, essentially mirroring the capacity of immune cells to recognize and react to diverse antigens, including viruses, bacteria, and other foreign substances (Britanova et al.2014; Hou et al.2016). A higher level of immune repertoire diversity indicates that an immune system has a broader antigen recognition range and can more proficiently handle a wide array of infections.
The Shannon–Wiener index (alternatively referred to as the Shannon diversity index or Shannon entropy) is used to measure species diversity in ecosystems (Hill1973); it takes into account two crucial aspects of biodiversity, species richness and evenness, and is calculated using the following formula:
where H′ represents the Shannon–Wiener index,Sis the total number of distinct clonotypes in the sample, andPiis the relative abundance of theith clonotype, which is simply the proportion of that particular type within the sample. The merit of this index is that it provides a well‐balanced assessment of diversity by considering both clone richness and evenness.
The Gini coefficient is commonly employed in economics to measure distribution inequality and can also be applied in the context of biodiversity to evaluate the unequal distribution of relative clone abundances. The formula for the Gini Coefficient is:
wherenis the total number of clones, andPiandPjare the relative abundances of theith andjth clones, respectively. The value of the Gini coefficient ranges from 0 to 1; a value closer to 0 implies a more equal distribution (meaning each clone has a similar relative abundance), while a value closer to 1 indicates a highly unequal distribution (suggesting that all the abundances are concentrated in just one clone). In immune repertoire analysis, a lower Gini coefficient indicates a more even clonal distribution, while a higher coefficient suggests dominance by a few clones. This index intuitively reflects clonal inequality and reveals immune diversity and antigen response specificity.
Clonal Sequence Similarity Analysis
Levenshtein distance (LD) is a metric used to quantify the minimum number of single‐character edits (deletions, insertions, or substitutions) required to change one string into another (Zhang et al.2020). We used LD to evaluate CDR3aa similarity among the top 1000 clones per sample, calculated with the R stringdist package (version 0.9.10). Focusing on the top 1000 clones standardized analysis across samples, reduced bias, and lowered computation load.
Clones were defined as being similar if they were part of a cluster where the pairwise LD was ≤ 1; this criterion allowed for a maximum of one amino acid change between pairs of CDR3 clone sequences (Zhang et al.2020). After LD calculation, clustering and network visualization were performed with the R igraph package (version 1.3.5). Cluster numbers were counted to reflect clonal similarity. In the network, nodes represent clones; node size corresponds to connectivity, and colors are random. This visualization intuitively displays clonal similarity patterns in the immune repertoire.
Clonal Annotation and Functional Analysis
TCR clone annotation databases are well‐developed, but BCR databases remain scarce; thus, only TCR clones were annotated in this study. We downloaded CDR3aa sequences and antigen annotations from VDJdb (Goncharov et al.2022), IEDB (Vita et al.2019), and McPAS‐TCR (Tickotsky et al.2017), integrated and deduplicated the data to obtain 182,283 unique functional TCR CDR3aa sequences, then matched our sequencing data against this reference to identify corresponding antigens.
To explore overlaps between peripheral blood–expanded TCR clones and tumor‐infiltrating clones, we obtained TRB sequences from the GEO database (GSE139555andGSE149652), which include multiple solid tumors and adjacent normal tissues. We intersected the top 1000 expanded peripheral blood clones with tumor and paracancerous sequences and counted shared clones, revealing potential links between circulating TCR clones and the tumor microenvironment.
Analysis of Clone Overlap Among Individuals
It has been hypothesized that individuals may possess immune system clones that have the potential to be directed against common antigens and these clones are considered to have crucial roles in pathogen‐specific responses and combating infections (Hou et al.2021). Nevertheless, a prominent characteristic of TCR and BCR repertoires is the high level of heterogeneity among individuals. Hence, individuals typically only share a relatively small number of clones (Xu et al.2023). To quantitatively assess the similarity in clone composition between different samples, the R immunarch package (version 0.8.0) was employed to calculate the overlap coefficient values of TCR and BCR clones (Hou et al.2021). The overlap coefficient is a standardized metric of overlap similarity, computed by dividing the number of shared clones (intersections) by the size of the smaller of the two sets being compared, allowing objective measurement of the degree of clone sharing among individuals and providing insights into the similarities and differences of their immune repertoires.
Aging Clock and Aging Rate
The training (PENGZU cohort), test (CMUCH cohort), and COVID‐19 infection (Post‐COVID‐19) datasets were used to evaluate aging clock and aging rate. Our study identified consistent age‐dependent TCR/BCR repertoire remodeling, including altered CDR3 features, reduced clonal diversity, disrupted clonal homeostasis, and stable V(D)J/V–J usage changes. These age‐associated signatures serve as ideal biomarkers for biological aging. We thus built a machine learning–based immune repertoire aging clock using TCR/BCR V/D/J/V–J usage rates as features (instead of global gene expression). The model was evaluated in the training (PENGZU), test (CMUCH), and post‐COVID‐19 datasets to assess aging clock performance and aging rate. The actual age of participants at the moment of sample collection was designated as the target variable. For the training dataset, the usage rates of all TCR and BCR V, D, J, and V–J gene combinations served as features within the aging prediction model.
Aging clock models were constructed using the tidymodels package (version 1.2.0) with nine distinct algorithms: Random Forest, Decision Tree, XGBoost, Lasso, Support Vector Machine (SVM), Neural Networks, Linear Regression, LightGBM, and K‐Nearest Neighbor (KNN). Subsequently, mean absolute error (MAE) values were compared within an external test set (CMUCH cohort). The algorithm that demonstrated the best performance was then chosen to formulate the final aging clock model.
Once the final aging clock was established, the difference between the predicted and actual age (AgeDiff), which served as a measure of the aging rate of individuals, was calculated using the following formula (Han2024; Moqri et al.2023; Zhu, Chen, et al.2023):
This parameter provides insights into impacts on health, disease, and longevity; a positive value signifies accelerated aging, whereas a negative value signifies a slower aging rate (Han2024; Moqri et al.2023; Zhu, Chen, et al.2023). To isolate the influence of actual age on AgeDiff and align with published methods (Zhu, Chen, et al.2023), AgeDiff was adjusted using a polynomial model fitted to age:
Adjusted AgeDiff (cAgeDiff) was then used as the ultimate metric for evaluating the aging rate of individuals.
To evaluate the variation in aging rates within each cohort and account for differences in cohort size, the PENGZU cohort was classified into three groups based on cAgeDiff quartiles (Q1, Q2, Q3) from the training dataset, as follows: quick‐aging (cAgeDiff > Q3), average‐aging (Q1 ≤ cAgeDiff ≤ Q3), and slow‐aging (cAgeDiff < Q1). Subsequently, the proportions of these different aging rate groups within each cohort (PENGZU, CMUCH, and Post‐COVID‐19) were computed and compared using chi‐square tests to facilitate detailed analysis of the aging patterns and differences among the cohorts, and identify factors potentially contributing to variations in aging rates.
Sample Size Saturation Analysis
Saturation analysis was conducted to evaluate whether sample size was adequate. The process was initiated using 20 samples. In each iteration, one additional sample was randomly selected and incorporated into the training dataset. After repeating this process 100 times for each sample size, the average values of “MAE” (Mean Absolute Error), “RMSE” (Root Mean Square Error), and “Spearman” correlation coefficient were calculated. This iterative procedure was designed to identify the point at which further increasing the sample size would no longer lead to a significant improvement in the model's performance.
Measurement of Intrinsic Capacity
The calculation of intrinsic capacity in this study involved multiple steps. First, a psychological score was calculated by summing depression symptom (DS), anxiety symptom (AS), and stress symptom (SS) scores, along with weighted scores for life self‐assessment and health self‐assessment, all obtained using questionnaires, according to the formula:
Second, scores were obtained based on specific cognitive, hearing, BMI, grip strength (right hand for men and left hand for women), and walking speed ranges and the vitality score calculated as follows:
Third, weights for each dimension (cognitive, hearing, vitality, walking speed, and psychological) were calculated using the entropy weight method.
Fourth, intrinsic function scores were obtained by weighted summation of the sub‐dimensions, followed by a Box‐Cox transformation with a positiveλto normalize the data distribution. Finally, scores were standardized from 0–1 and linearly mapped to 0–100.
Statistical Analysis
All statistical analyses and data visualizations were conducted using R software (version 4.1.3). The Wilcoxon rank‐sum test was employed to compare differences between two groups, and the Kruskal–Wallis test was used for comparisons of multiple groups. Spearman's rank correlation was applied for correlation analysis. These statistical methods are non‐parametric tests, which do not rely on the assumption of normally distributed data. Ap‐value < 0.05 was considered to indicate statistical significance.
Results
Age‐Related Variations in TCR and BCR Nucleotide and Amino Acid Characteristics
TCR and BCR CDR3 sequence data were generated from 195 healthy volunteers aged 25–93 years, including the PENGZU (n= 122) and CMUCH (n= 72) cohorts, recruited from November 2019 to February 2020 in two separate hospitals (Table1).
TCR CDR3 nucleotide (CDR3nt) sequence lengths were mainly distributed in the range 31–36 bp (FigureS2A), while BCR CDR3nt lengths were primarily in the range 37–42 bp (FigureS2B). We calculated Spearman correlations for each individual CDR3 length bin independently. With aging, the immune repertoire undergoes global contraction: most frequent/functional length bins decrease, while only a few rare bins show small increases. Thus, most bins show negative correlations with age. Analysis of correlations with age demonstrated that TCR CDR3nt sequence lengths were mainly negatively correlated with age (FigureS2C,D). The functional region derived from CDR3nt, comprising the CDR3 amino acid (CDR3aa) sequence, is directly involved in antigen recognition. The most common TCR and BCR CDR3aa lengths were 11–12 and 13–14 aa, respectively (Figure1A,B) and these were also generally negatively correlated with age (Figure1C,D).
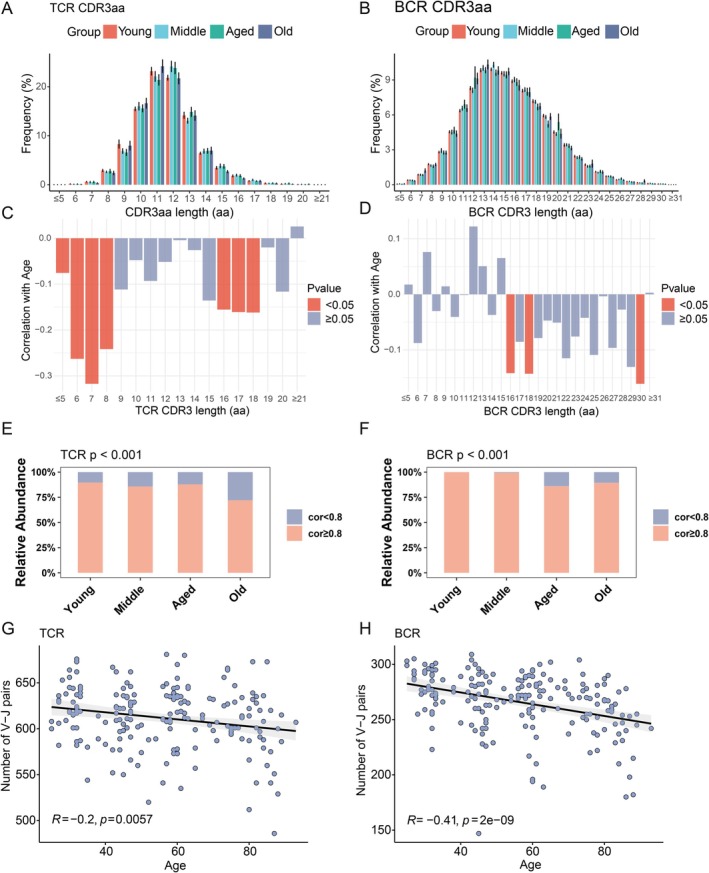
Relationships between CDR3aa and V–J gene combination types according to age. (A, B) Distributions of TCR and BCR CDR3aa lengths. (C, D) Correlation analysis of TCR and BCR CDR3aa length frequency with age. (E, F) Similarity analysis of CDR3aa length distributions among individuals. Using similarity coefficient (cor) 0.8 as the cutoff value, the proportions of sample pairs with cor values ≥ 0.8 and < 0.8 were calculated according to age group and compared by chi‐square test. (G, H) Correlations of numbers of V–J gene combination types with age.
We further explored the differences among individuals in TCR and BCR CDR3aa sequence length distributions by conducting Spearman's correlation analysis to compare the CDR3aa sequence length distribution frequencies across various samples and examining the proportion of specific similarity results according to age group using a coefficient cutoff value of 0.8. Samples were classified into Young (25–44 years), Middle (45–59 years), Aged (60–74 years), and Old (75–93 years) age groups, and the proportions of sample pairs among groups with similarity coefficients ≥ 0.8 and < 0.8 were compared using the chi‐square test (Mai et al.2023). As age increased, there was a significant decline in CDR3aa sequence length distribution similarity among samples (Figure1E,F), indicating a loss of homogeneity of the immune repertoire. This result indicates that during age‐related immunosenescence, the CDR3 length distribution undergoes substantial remodeling, and the divergence of immune repertoire sequence profiles across individuals increases with age.
The frequencies of different types of CDR3aa in the entire population are presented in FigureS3A,B. Analysis of correlations with age demonstrated that TCR CDR3aa frequency exhibited more pronounced age‐related changes than that of BCR (FigureS3C).
Age‐Associated Alterations in VDJ and V–J Gene Combination Usage
The usage rates of all VDJ genes and V–J combinations are visualized in FigureS4A–H. Genes with potentially dominant roles in the immune response are presented in FigureS5A–F. Each V/D/J gene and each V–J combination was tested by independent Spearman correlation. Due to age‐related repertoire contraction, most dominant V genes and common V–J combinations decline, while only a few rare genes increase slightly. This results in predominantly negative correlations. Analysis of correlations with age demonstrated that VDJ gene usage rates were mainly negatively correlated with age (FigureS5G–L). Similarly, V–J combination usage rates were also predominantly negatively correlated with age (FigureS6A,B). Moreover, the number of V–J combination types decreased notably with age (Figure1G,H), while similarity analysis of VDJ gene usage rates among samples demonstrated that there were greater differences among samples with increasing age (FigureS7A–D).
Age‐Related Patterns in TCR/BCR Clone Characteristics and Their Implications
Clonotype count, which denotes the number of specific clonotypes in an immune repertoire, was analyzed separately for TCRs and BCRs. Both TCR and BCR clonotype counts declined significantly with age (p< 0.05); the decline rate for TCR clonotype count was 179.70 per 3 years and that for BCR was 507 per 3 years, indicating a more rapid decrease in BCR clonotype count (Figure2A,B).
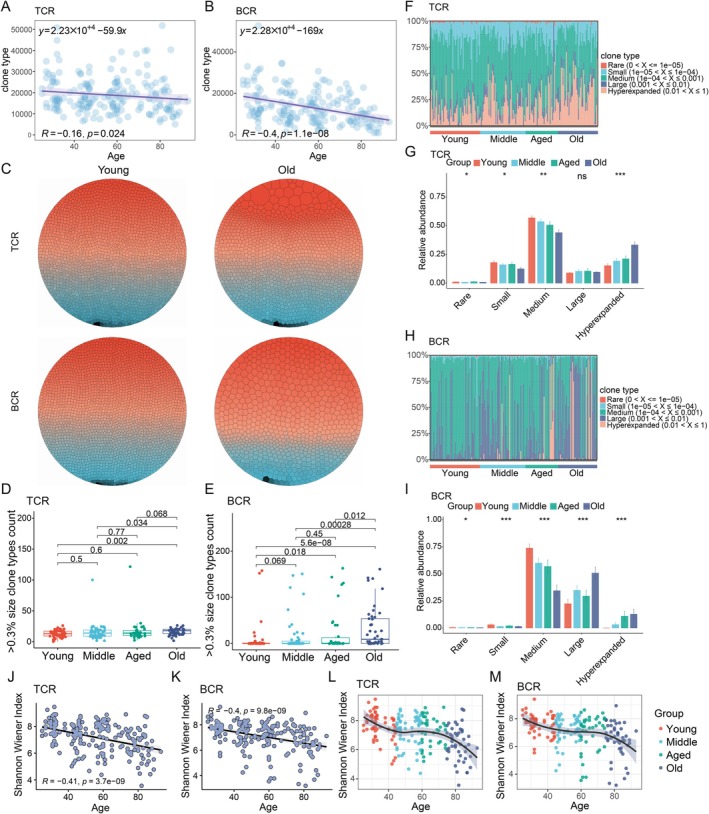
*Characteristics of clone changes during aging. (A, B) Changes in TCR and BCR clonotype counts with age. (C) Clone sizes of representative samples from young and old individuals. In the Voronoi treemap, each polygon represents a unique CDR3aa clonotype and its area is proportional to its relative frequency within the sample. The color gradient (from blue to red) indicates clone abundance, with redder‐colored polygons representing higher‐frequency clonotypes and bluer polygons representing lower‐frequency clonotypes. (D, E) Comparison of clonotype counts > 0.3% in each age group. (F, G) TCR clonotype proportion homeostasis analysis. *p< 0.05, **p< 0.01, ***p< 0.001, ns, no significant. (H, I) BCR clonotype proportion homeostasis analysis. **p< 0.01, **p< 0.001. (J, K) Analysis of correlations between clone diversity (Shannon–Wiener index) and age. (L, M) Locally weighted regression (LOESS) analysis of clone diversity and age.
Clonotype proportion (size) is vital to understanding immune responses and aging. Clonotype sizes in various samples are visualized in Figure2C, and show that individual clonotypes tended to enlarge with age (Figure2D,E), suggesting that aging impacts immune function by decreasing clonotype counts and increasing their proportions.
For a more detailed analysis of TCR and BCR clonotype size changes with age, we evaluated clonotype size homeostasis, with clonotypes categorized as rare, small, medium, large, and hyperexpanded (Zhu, Chelysheva, et al.2023). For TCR (Figure2F,G), the proportion of hyperexpanded clonotypes increased significantly with age, while those of small and medium clonotypes decreased (p< 0.01), and large clonotypes showed no significant change (p> 0.05), while the increased proportion of hyperexpanded clonotypes was prominent in the Old participant group (p< 0.001). For BCR (Figure2H,I), large clonotypes showed a clear increasing trend with age, followed by hyperexpanded clonotypes, while the proportions of small and medium clonotypes decreased significantly (p< 0.001). In older age participants, TCRs included more hyperexpanded clonotypes, while BCRs were characterized by an increase in large clonotypes.
It has been hypothesized that individuals may carry TCR/BCR clones against common antigens, which are crucial for pathogen responses (Hou et al.2021); however, TCR/BCR repertoires are highly heterogeneous, with few shared clones (Xu et al.2023). Next, we calculated the overlap coefficient of TCR/BCR clones among samples and found that most samples from different age groups had low overlap coefficients (FigureS8A,B). After dividing results by the cutoff value (0.2), an increased overlap coefficient was detected among Old group samples (chi‐square test) (FigureS8C,D).
As we were unable to detect clones shared among all samples, intersection analysis was conducted using samples grouped by age (FigureS8E,F). We identified 13,231 shared TCR clones (0.5% of total), along with 3094 shared BCR clones (0.1% of total), demonstrating that shared clones comprised small fractions of both types of receptor. Further, unique TCR/BCR clones decreased with age, implying reduced immune system ability to generate new antigen‐targeting clones.
Clone diversity is indicative of immune function (Britanova et al.2014; Hou et al.2016), and we found that TCR/BCR diversity decreased with age (Figure2J,K), while clone abundance became more uneven (FigureS8G,H). Nonlinear fitting suggested a turning point around 60 years for changes in TCR/BCR diversity (Figure2L,M).
Analysis of the Top 1000 Clones and Their Characteristics
After determining the clone proportions in each sample, we selected the top 1000 for in‐depth analysis, to highlight the most highly representative and biologically significant clones (Jin et al.2018). Notably, the total proportions of clones in the top 1000 increased with age for both TCR and BCR (FigureS9A,B).
To further explore the characteristics of the selected clones, we calculated the Levenshtein distance between the top 1000 CDR3aa sequence clones (n= 195,000 sequences); the process involved in this calculation is illustrated in FigureS9C. Clusters were defined as those containing clones with a pairwise distance ≤ 1, signifying a maximum of one amino acid difference between CDR3aa sequences (Zhang et al.2020). Interestingly, the number of TCR clusters was not significantly correlated with age (FigureS9D), whereas the number of BCR clusters increased significantly with age (FigureS9E).
In an attempt to understand the functions of these clones, we next annotated them using 182,283 known functional TCR CDR3aa sequences from relevant databases. Of the top 1000 TCR clones, 5534 were successfully annotated with antigen types. Subsequently, we examined the correlations between proportions of clones corresponding to different antigen types and age, and identified a significant positive correlation with a specific tumor disease and negative correlations with various pathogenic microorganisms (FigureS9F).
Given the potential clinical relevance of our findings, we retrieved data from the GEO database (GSE139555andGSE149652) to determine whether the TCR clones expanded in peripheral blood were also present in tumors and found that the number of shared clones was significantly higher in tumors than in adjacent tissues (FigureS9G,H).
Changes in CDR3 and VDJ Gene Usage After COVID‐19
During the COVID‐19 pandemic, we conducted a follow‐up study of 94 individuals from the PENGZU cohort; ultimately, TCR‐seq and BCR‐seq data were analyzed from 91 and 92 individuals, respectively (Table1). Post‐COVID‐19, a significant decline was observed in the similarities of abundance distributions among samples, regardless of whether CDR3 length distribution or VDJ gene usage rates were analyzed (FiguresS10A–Fand3A,B).
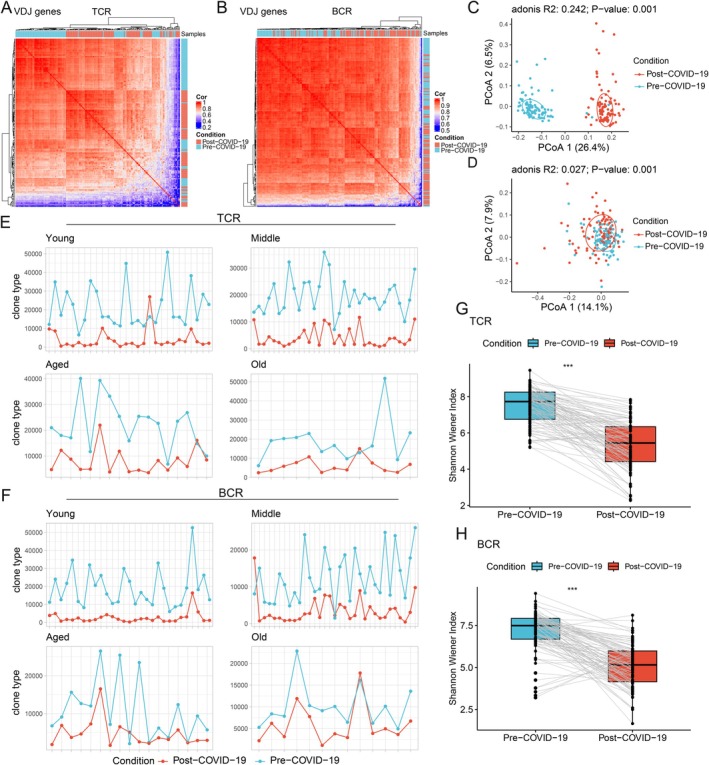
*Characteristics of changes in gene usage rates and clone numbers after COVID‐19. (A, B) Heatmaps of similarity coefficient values indicating gene usage distributions among samples. (C, D) Principal component analysis of TCR and BCR gene usage rates. (E, F) Comparisons of decreases in clone numbers among different age groups after COVID‐19. (G, H) Changes in Shannon–Wiener index values after COVID‐19. **p< 0.001.
We further conducted separate counts of the frequencies of the 20 amino acids in both TCRs and BCRs for each sample after SARS‐CoV‐2 infection and contrasted the results with those from pre‐infection samples, revealing that SARS‐CoV‐2 infection had a more pronounced influence on the amino acid usage rate in TCRs than in BCRs (FigureS11A,B).
Moreover, we found that samples could be effectively differentiated based on VDJ gene usage rates before and after SARS‐CoV‐2 infection (Figure3C,D), suggesting a substantial alteration in gene usage rates after virus infection. These findings were based on relative‐frequency normalized data and were supported by sequencing saturation and PCA analyses, minimizing potential confounding from sequencing depth and batch effects. Our subsequent analysis of the differences in gene usage rates further corroborated this observation (FigureS12).
Changes in Clone Quantity and Diversity After COVID‐19
The results of shared clone analysis demonstrated that only a tiny fraction of clones were shared both prior to and after COVID‐19 (FigureS13A,B). Specifically, there were 46,557 shared TCR clones, accounting for 2.74%, and only 4211 shared BCR clones, equating to 0.32%. The low proportion of shared clones before and after COVID‐19, together with global changes in clonotype number, diversity, clonal structure, and gene usage, collectively indicates significant biological remodeling of the immune repertoire following SARS‐CoV‐2 infection. To assess the changes in shared clones within groups before and after COVID‐19, we separately calculated overlap coefficient values for both groups (FigureS13C–H). The findings indicated that the overlap coefficient between samples rose significantly after SARS‐CoV‐2 infection, suggesting induction of a similar immune response pattern. Moreover, we discovered that the number of clonotypes decreased markedly following COVID‐19 (FigureS13I,J).
To explore differences in clone responses between younger and older individuals following SARS‐CoV‐2 infection, we compared the extents of decline among TCR and BCR clonotypes in the same individuals across different age groups (Figure3E,F), and found that the mean extent of decline reduced with increasing age (FigureS14A,B). This finding suggests that older adults are less able than younger individuals to mobilize clones focused on combating the virus after SARS‐CoV‐2 infection.
The Shannon–Wiener index represents overall immune repertoire diversity, while the Gini coefficient reflects the unevenness of clonal abundance distribution. After COVID‐19, Shannon–Wiener index values decreased significantly (Figure3G,H), while the Gini coefficient increased significantly (FigureS14C,D), indicating that COVID‐19 resulted in a decrease in clone diversity and a more uneven distribution of clone relative abundance.
Clone Size and Proportion Changes Before and After COVID‐19
We also compared the alterations in clone size prior to and after SARS‐CoV‐2 infection. The changes in TCR and BCR clone sizes in representative samples of both young and older individuals before and after COVID‐19 are presented in Figure4A–D. Visually, it is clear that the sizes of both TCR and BCR clones were significantly higher after COVID‐19, irrespective of age, and that clone size rose significantly following infection (Figure4E,F).
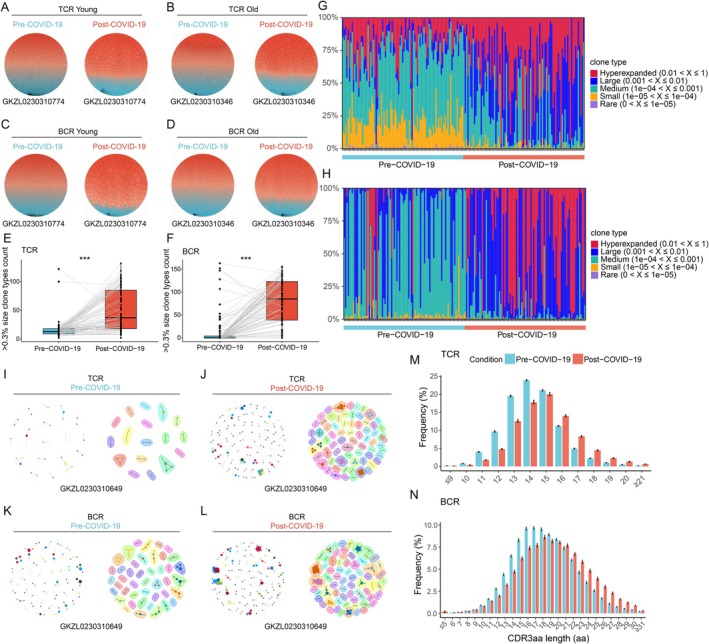
*Changes in clone size and CDR3 sequences after COVID‐19. (A–D) Visualization of TCR and BCR clone sizes in the same individual before and after COVID‐19. In the Voronoi treemap, each polygon represents a unique CDR3aa clonotype and its area is proportional to its relative frequency within the sample. The color gradient (from blue to red) indicates clone abundance, with redder‐colored polygons representing higher‐frequency clonotypes and bluer polygons representing lower‐frequency clonotypes. (E, F) Comparison of numbers of TCR and BCR clones > 0.3% before and after infection. (G, H) Proportions of different sized clones. **p< 0.001. (I–L) Cluster network diagrams of the top 1000 TCR and BCR clones from a representative sample (GKZL0230310649) with Levenshtein distance ≤ 1. In the clonotype similarity network, each node represents a CDR3aa clonotype and edges connect clonotypes with Levenshtein distance ≤ 1. Node size is proportional to node degree. Node colors are used for visualization and do not represent specific biological features. (M, N) Frequency distribution of the amino acid sequence lengths of the top 1000 amplified clones.
Subsequently, we analyzed the proportions of rare, small, medium, large, and hyperexpanded clones in each sample; the proportions of clones of different sizes are presented in Figure4G,H. The distribution pattern of clones of various sizes in the samples changed significantly after COVID‐19, with the proportions of hyperexpanded and large clones showing particularly notable increases. We next compared the proportions of clones of different sizes among groups (FigureS15A,B) and found that rare, small, and medium clone proportions were significantly lower in samples after COVID‐19 than those before infection, while the proportions of large and hyperexpanded clones were significantly higher (p< 0.001).
Moreover, we compared the clonal expansion capacity after COVID‐19 among different age groups. The proportions of rare and small TCR clones in younger patients were significantly lower than those in older individuals; however, starting from large clones, proportions were higher in younger patients, particularly for hyperexpanded clones, which were significantly more prominent (FigureS15C). The pattern in BCR clones differed somewhat from that in TCR clones. Younger patients had significantly fewer large clones than older patients, but significantly more hyperexpanded clones (FigureS15D).
Analysis of Expanded Clones Before and After COVID‐19
Since expanded clones may be crucial to the immune response to COVID‐19, we analyzed the top 1000 expanded clones from each sample pre‐ and post‐infection, where similar clone sequences suggest similar functions. Similarity analysis results for the top 1000 TCR and BCR clones in representative samples are shown in Figure4I–L. TCR and BCR cluster numbers were clearly higher after infection (FigureS15E,F), reflecting the anti‐virus immune response. Further, the amino acid sequence length of the top 1000 expanded clones was significantly higher following COVID‐19 (Figures4M,NandS15G,H).
The top 1000 pre‐ and post‐infection TCR clones were next annotated using data from known TCR clones available in databases. A total of 5642 clones were annotated with pathogen types. Among the top 6 pathogen types in these clones, SARS‐CoV‐2 was the most common (59.87% of annotated clones;n= 3378 clones; FigureS16A).
To identify the main pathogens targeted by these annotated clones, we calculated and compared the amplification frequency of the top 6 annotated clones in each sample. As SARS‐CoV‐2 shares epitopes with other coronaviruses, non‐infected individuals may generate cross‐reactive non‐specific clones (Loyal et al.2021); therefore, we identified SARS‐CoV‐2‐related clones in samples from the healthy population. We noted that SARS‐CoV‐2‐specific TCRs are highly enriched in current public antigen‐specific TCR databases, which may partially contribute to the high proportion of SARS‐CoV‐2‐related clones among the top six pathogen‐associated clones. However, the significant and specific expansion of these clones in post‐COVID individuals supports their biological relevance to SARS‐CoV‐2 infection.
Comparison of amplification frequencies based on clone annotation demonstrated that the frequency of SARS‐CoV‐2‐related clones was significantly higher post‐infection (FigureS16B;p< 0.001). The frequency ofMycobacterium tuberculosis(TB)‐related clones was also increased (FigureS16E;p< 0.05), possibly due to SARS‐CoV‐2 activating opportunistic viral DNA to trigger latent TB infections (Can et al.2020; Crisan‐Dabija et al.2020; Xu et al.2023).
Construction of an Immune Repertoire Aging Clock Model
The aging clock model was primarily trained using age‐associated V(D)J usage frequency features (V, D, J genes and V–J combinations), rather than CDR3 sequence‐level features. To construct an aging clock model, we selected samples with complete data for both TCR and BCR. The healthy cohort was divided into training and testing datasets, according to different sample collection locations. Specifically, 122 healthy individuals from Beijing Hospital (PENGZU cohort), all of whom had complete TCR and BCR data, served as the training dataset, while information from 72 healthy individuals from the Chest Hospital (CMUCH cohort), also with complete TCR and BCR data, was used as the testing dataset; 90 samples from the PENGZU cohort (Post‐COVID‐19) served as a disease testing dataset.
To improve the robustness and predictive ability of the model, we selected 55 genes that showed consistent age‐related changes in different cohorts to construct the aging clock model (Figure5A,B). Additionally, we compared the performance of nine different machine learning algorithms using an external test set (CMUCH cohort) and found that the LightGBM model performed best (Figure5C). The age prediction results for different cohorts are presented in Figure5D–F. The SHapley Additive exPlanations (SHAP) value distribution for the 55 genes is presented in Figure5G. Through sample‐size saturation analysis of the training set, we determined that the 122 reference samples used to build the clock were sufficient to achieve stable high accuracy (Figure5H).
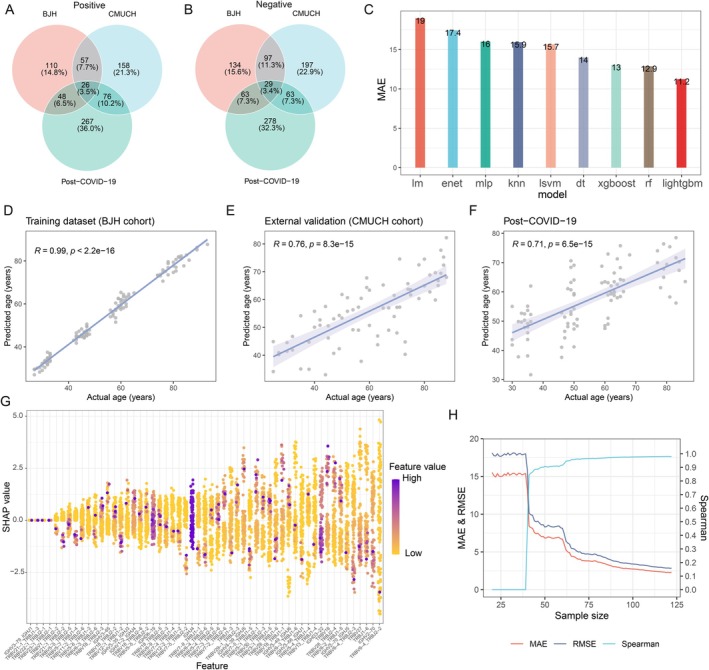
Establishment and application of an aging clock model. (A, B) Intersection of genes with consistent age‐related change trends across different cohorts. (C) Comparison of age prediction performance using 9 machine learning algorithms in an external test set. MAE, mean absolute error; lm, linear regression; enet, Lasso; mlp, neural networks; knn, K‐nearest neighbor; lsvm, support vector machine; dt, decision tree; xgboost, XGBoost; rf, random forest; lightgbm, LightGBM. (D–F) Correlation between predicted and actual age across different cohorts. (G) SHAP (SHapley Additive exPlanations) value distribution of the 55 genes. (H) Sample saturation analysis.
Aging Rate Changes After COVID‐19 and Their Association With Health Status
The aging rate (cAgeDiff) computed using our aging clock increased significantly after COVID‐19 infection, yet no notable difference was detected between the healthy cohorts (Figure6A). The proportion of individuals with accelerated aging also rose significantly following COVID‐19 infection (Figure6B). These data imply that we successfully established an aging clock, which detected a substantial increase in the aging rate after COVID‐19 infection.
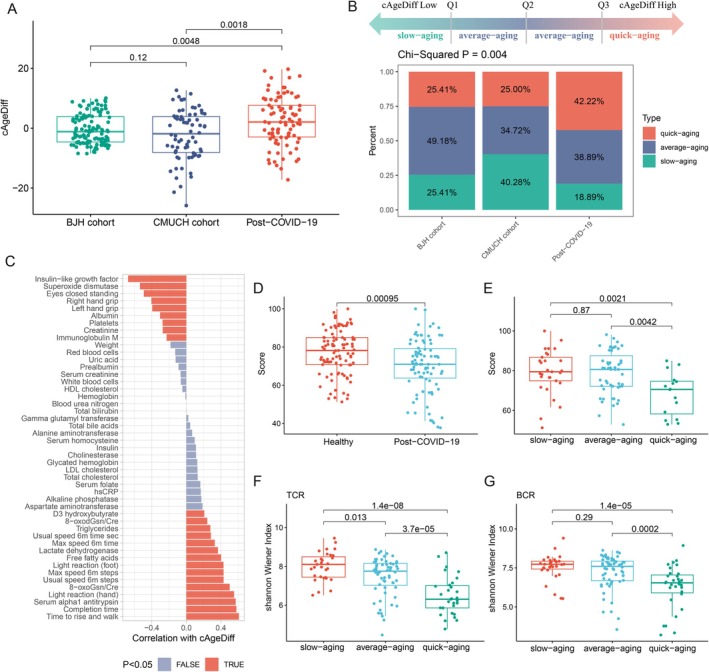
Analysis of the clinical characteristics of individuals with different aging rates. (A) Comparison of aging rates (cAgeDiff) across different cohorts. (B) Chi‐square test comparing proportions of different aging rate categories based on quartiles of cAgeDiff from the training set. (C) Analysis of correlations between aging rate and clinical laboratory test indicators. (D) Comparison of intrinsic capacity scores between healthy individuals and patients with COVID‐19. (E) Comparison of intrinsic capacity scores among individuals with different aging rates. (F, G) Comparison of TCR and BCR diversity among individuals with different aging rates.
In the healthy population, to examine whether aging rate calculated using our model reflects health status, we conducted correlation analyses between the aging rate and various clinical laboratory test indicators and discovered significant correlations with indicators associated with physical function, including standing with eyes closed and grip strength of both hands, as well as blood composition indicators and insulin‐like growth factor. Remarkably, levels of superoxide dismutase in the body decreased, while oxidative nucleic acid metabolites in the urine increased significantly with increased aging rate, suggesting that aging rate has the potential to mirror health status (Figure6C). Subsequently, we quantified intrinsic capacity scores for each participant to assess individual health status (Beard et al.2022), revealing a significant reduction in intrinsic capacity after COVID‐19 infection (Figure6D). Interestingly, as the aging rate accelerated, both intrinsic capacity score and immune function were significantly decreased (Figure6E–G).
Discussion
The findings of this study provide valuable insights into the TCR and BCR changes associated with aging and COVID‐19. Our analysis of CDR3 structure revealed that CDR3 length distribution is influenced by aging, highlighting a potential impact of aging on the ability of the immune system to recognize and respond to antigens, as CDR3 length is crucial for antigen binding specificity. The differences in the most frequent CDR3aa lengths between TCRs and BCRs also suggest functional differences in the interactions of these receptors with antigens. TCRs also exhibited more significant changes in amino acid usage than BCRs, suggesting that TCR may be more vulnerable to age‐related impacts. Further, the decrease in VDJ gene and V–J combination usage with age reflects compositional contraction of the immune repertoire. Although frequencies sum to 100% per sample, aging drives global homogenization: most functional V genes and dominant V–J pairs are reduced, while only a few rare clones expand slightly. This dominant reduction leads to fewer clonotypes and lower diversity (Song et al.2022), suggesting that the immune response may be altered with age, potentially affecting the ability to combat disease. Additionally, the faster decline in the number of BCR clonotypes, relative to that of TCR clonotypes, suggests that BCRs may be more susceptible to the effects of aging than TCRs.
Although this study did not quantify the contributions of genetics, environment, and epigenetics to immune repertoire aging, it identified key aging signatures in a large Chinese cohort and built an immune repertoire aging clock. Our population baseline data supports cross‐population comparisons to distinguish genetic and environmental effects. The 55 age‐associated genes and molecular features can serve as candidate markers. Combined with multi‐omics data, these findings will help quantify regulatory factors in immune repertoire aging. Clonal diversity reflects physiological immune capacity. The decline in clonal types with age leads to reduced immune repertoire diversity. Mika et al. found TCR repertoire diversity drops sharply before 18 years old, subsequently stabilizing until old age (Mika et al.2023), while Britanova et al. showed that it declines linearly with age, notably by 40‐years‐old (Britanova et al.2014); hence the rate of immune repertoire diversity decline clearly varies with age. There are no reports on BCR repertoire decline at different ages. Our data demonstrate a rapid decline in TCR and BCR diversity in the Young (25–44 years) group, which stabilized in the Middle (45–59 years) group, and accelerated again in the Aged (60–74 years) group, continuing in the Old (75–93 years) group. These findings reveal a non‐uniform rate of TCR and BCR diversity change with age, with a possible turning point around 60‐years‐old, potentially related to natural immune system aging. Furthermore, we first quantified divergent aging features of TCR and BCR. BCR clonotype count declined significantly faster (507 per 3 years) than TCR (179.7 per 3 years), confirming higher BCR sensitivity to aging. Compared with Song et al. (Song et al.2022), our study expands analyses to multiple dimensions and provides a more comprehensive reference for immune repertoire aging. Comparison of diversity between sexes, after stratifying by age group, did not reveal any differences between men and women (FigureS17A,B), consistent with previous reports indicating that changes in immune repertoire diversity are unrelated to sex (Lian et al.2019).
Analysis of the top 1000 expanded clonotypes showed that similarity among BCR clones increased with age, while no similar trend was observed for TCRs. This difference in aging‐related clonal changes between TCRs and BCRs has not been reported previously and warrants further investigation.
Our study also confirms the importance of TCRs in tumor immunity, as the proportion of tumor‐associated TCR clonotypes increased with age, while that of pathogen‐related clonotypes decreased. The identification of shared clonotypes between peripheral blood and various solid tumors emphasizes the potential for using peripheral blood clonotype detection to assist in tumor diagnosis and assessment of tumor immune status (Wu et al.2020).
Our analysis of clone size and clone size distribution before and after COVID‐19 revealed differences in immune responses to COVID‐19 among different age groups, indicating that the immune systems of younger individuals may more easily generate large and hyperexpanded clones in response to COVID‐19, potentially resulting in stronger immune responses against the virus. Further, the higher CDR3aa sequence lengths detected following COVID‐19 may reflect improved clone functionality, as longer sequences can encode more functional domains to enhance protein activity and binding, thereby helping to maintain an effective anti‐virus response. It should be noted that the post‐COVID‐19 repertoire data in this study were derived from follow‐up samples collected after SARS‐CoV‐2 infection rather than during the acute infection stage. Therefore, the observed repertoire remodeling likely reflects persistent immune alterations after infection and/or the convalescent immune response. Nevertheless, because the time interval between infection and sampling was not identical for all individuals, we cannot fully distinguish acute‐phase transient effects from long‐lasting post‐infection changes. Future studies with serial sampling at defined time points (acute, early convalescence, and long‐term recovery) will be required to clarify the temporal dynamics of COVID‐19‐associated immune repertoire remodeling.
Machine learning has frequently been applied to establish aging prediction models (Haug and Drazen2023); for example, metabolomic (Zhang et al.2024), microbiome (Wang et al.2024), transcriptomic (Zhu, Chen, et al.2023), and epigenetic (Cao et al.2022; Horvath2013; Radak et al.2024) aging clocks; however, immune repertoire aging clocks are lacking. The development of an aging clock based on TCR and BCR gene usage data is a significant achievement of this study. Further, our finding that COVID‐infection significantly accelerates aging, as indicated by increased cAgeDiff value, is consistent with the results of previous studies on epigenetic aging clocks (Cao et al.2022). These data suggest that SARS‐CoV‐2 infection not only affects the immune response, but also has a profound impact on the aging process.
Aging is considered a significant factor influencing the severity of COVID‐19 (Williamson et al.2020). Our analysis of TCR/BCR clone changes across different age groups after SARS‐CoV‐2 infection is consistent with data demonstrating that younger individuals exhibit more active immune responses (Lavezzo et al.2020; Tabata et al.2020), as we found a greater reduction in clone numbers and a higher abundance of hyperexpanded clones. Using paired pre‐ and post‐COVID‐19 samples, our analysis extends beyond acute immune responses to long‐term effects. The within‐subject design confirms COVID‐19 directly triggers persistent TCR/BCR remodeling rather than transient acute changes. We first reveal age‐dependent differences in post‐COVID immune responses, with younger patients displaying stronger immune plasticity. COVID‐19 enriches not only SARS‐CoV‐2‐specific clones but alsoMycobacterium tuberculosis‐associated clones, implying potential activation of opportunistic infection‐related repertoires. We further link post‐COVID repertoire alterations to accelerated immune aging, with elevated aging clock values associated with lower host resilience and diversity. These findings establish a direct link between COVID‐19 and accelerated immune aging, filling critical gaps in the immune mechanisms of post‐COVID conditions. This information regarding age‐related immune responses can guide clinicians in developing more personalized treatment plans.
Conclusions
In summary, this study advances immune repertoire, aging and COVID‐19 research. We established age‐stratified TCR/BCR baseline data in a large Chinese cohort, identified age 60 as a key aging turning point, and revealed divergent TCR/BCR aging patterns. We developed the first LightGBM‐based immune repertoire aging clock for precise immune aging evaluation. We demonstrate COVID‐19 accelerates immune repertoire aging and links post‐infection remodeling to host resilience and opportunistic infection risk, providing molecular targets for post‐COVID interventions. Limitations include lack of exploration on aging reversibility and interventions. Future studies may help delay age‐related immune decline and alleviate post‐COVID immune dysfunction.
Author Contributions
Xin Gao:conceptualization, methodology, formal analysis, investigation, data curation, writing – original draft, visualization.Si‐Jia Li, Jin Li, Zi‐Hui Wang, and Lv‐Tao Zeng:conceptualization, software, writing – original draft.Ya‐Qing Ma and Ya‐Min Dang:conceptualization, investigation, writing – original draft.Ying‐Min Zhang and Hong‐Lei Liu:software, validation.Li‐Qun Zhang and Jing Pang:investigation.Ju Cui:writing – review and editing.Tie‐Mei Zhang and Jian‐Ping Cai:conceptualization, writing – review and editing.
Funding
This work was supported by National High Level Hospital Clinical Research Funding (BJ‐2024‐138), CAMS Innovation Fund for Medical Sciences (No. 2021‐1‐I2M‐050), and the National Natural Science Foundation of China (No. 82170856).
Ethics Statement
Peripheral blood samples were collected during routine procedures with written informed consent, in accordance with the approval of the Ethics Committee of Beijing Hospital (Approval No. 2019 BJYYEC‐054‐02).
Consent
All participants signed informed consent forms and were notified about the study before participating.
Conflicts of Interest
The authors declare no conflicts of interest.
Acknowledgments
The authors are grateful to the members of the Institute of Geriatrics of the Ministry of Health for their assistance and advice.
Contributor Information
Tie‐Mei Zhang, Email: tmzhang126@126.com.
Jian‐Ping Cai, Email: caijp61@vip.sina.com.
Data Availability Statement
Data reported in this paper will be shared by the lead contact upon request. Analysis core code is available athttps://github.com/xingao0612/Core_Code. Any additional information required to reanalyze the data reported in this paper is available from the lead contact upon request.
Associated Data
Data Availability Statement
Data reported in this paper will be shared by the lead contact upon request. Analysis core code is available athttps://github.com/xingao0612/Core_Code. Any additional information required to reanalyze the data reported in this paper is available from the lead contact upon request.
References
- Beard, J. R. , Si Y., Liu Z., Chenoweth L., and Hanewald K.. 2022. “Intrinsic Capacity: Validation of a New WHO Concept for Healthy Aging in a Longitudinal Chinese Study.” Journals of Gerontology. Series A, Biological Sciences and Medical Sciences 77, no. 1: 94–100. 10.1093/gerona/glab226. doi.org/10.1093/gerona/glab226
- Brauning, A. , Rae M., Zhu G., et al. 2022. “Aging of the Immune System: Focus on Natural Killer Cells Phenotype and Functions.” Cells 11, no. 6: 1017. 10.3390/cells11061017. doi.org/10.3390/cells11061017
- Britanova, O. V. , Putintseva E. V., Shugay M., et al. 2014. “Age‐Related Decrease in TCR Repertoire Diversity Measured With Deep and Normalized Sequence Profiling.” Journal of Immunology 192, no. 6: 2689–2698. 10.4049/jimmunol.1302064. doi.org/10.4049/jimmunol.1302064
- Can, S. R. , Sili U., Eryuksel E., Olgun Y. S., Cimsit C., and Karahasan Y. A.. 2020. “Tuberculosis and COVID‐19: An Overlapping Situation During Pandemic.” Journal of Infection in Developing Countries 14, no. 7: 721–725. 10.3855/jidc.13152. doi.org/10.3855/jidc.13152
- Cao, X. , Li W., Wang T., et al. 2022. “Accelerated Biological Aging in COVID‐19 Patients.” Nature Communications 13, no. 1: 2135. 10.1038/s41467-022-29801-8. doi.org/10.1038/s41467-022-29801-8
- Crisan‐Dabija, R. , Grigorescu C., Pavel C. A., et al. 2020. “Tuberculosis and COVID‐19: Lessons From the Past Viral Outbreaks and Possible Future Outcomes.” Canadian Respiratory Journal 2020: 1401053. 10.1155/2020/1401053. doi.org/10.1155/2020/1401053
- Diao, B. , Wang C., Tan Y., et al. 2020. “Reduction and Functional Exhaustion of T Cells in Patients With Coronavirus Disease 2019 (COVID‐19).” Frontiers in Immunology 11: 827. 10.3389/fimmu.2020.00827. doi.org/10.3389/fimmu.2020.00827
- Goncharov, M. , Bagaev D., Shcherbinin D., et al. 2022. “VDJdb in the Pandemic Era: A Compendium of T Cell Receptors Specific for SARS‐CoV‐2.” Nature Methods 19, no. 9: 1017–1019. 10.1038/s41592-022-01578-0. doi.org/10.1038/s41592-022-01578-0
- Han, J. J. 2024. “The Ticking of Aging Clocks.” Trends in Endocrinology and Metabolism 35, no. 1: 11–22. 10.1016/j.tem.2023.09.007. doi.org/10.1016/j.tem.2023.09.007
- Haug, C. J. , and Drazen J. M.. 2023. “Artificial Intelligence and Machine Learning in Clinical Medicine, 2023.” New England Journal of Medicine 388, no. 13: 1201–1208. 10.1056/NEJMra2302038. doi.org/10.1056/NEJMra2302038
- Hill, M. O. 1973. “Diversity and Evenness: A Unifying Notation and Its Consequences.” Ecology 54, no. 2: 427–432. 10.2307/1934352. doi.org/10.2307/1934352
- Horvath, S. 2013. “DNA Methylation Age of Human Tissues and Cell Types.” Genome Biology 14, no. 10: R115. 10.1186/gb-2013-14-10-r115. doi.org/10.1186/gb-2013-14-10-r115
- Hou, X. , Wang G., Fan W., et al. 2021. “T‐Cell Receptor Repertoires as Potential Diagnostic Markers for Patients With COVID‐19.” International Journal of Infectious Diseases 113: 308–317. 10.1016/j.ijid.2021.10.033. doi.org/10.1016/j.ijid.2021.10.033
- Hou, X. , Wang M., Lu C., et al. 2016. “Analysis of the Repertoire Features of TCR Beta Chain CDR3 in Human by High‐Throughput Sequencing.” Cellular Physiology and Biochemistry 39, no. 2: 651–667. 10.1159/000445656. doi.org/10.1159/000445656
- Hu, B. , Guo H., Zhou P., and Shi Z. L.. 2021. “Characteristics of SARS‐CoV‐2 and COVID‐19.” Nature Reviews. Microbiology 19, no. 3: 141–154. 10.1038/s41579-020-00459-7. doi.org/10.1038/s41579-020-00459-7
- Jin, Y. B. , Luo W., Zhang G. Y., et al. 2018. “TCR Repertoire Profiling of Tumors, Adjacent Normal Tissues, and Peripheral Blood Predicts Survival in Nasopharyngeal Carcinoma.” Cancer Immunology, Immunotherapy 67, no. 11: 1719–1730. 10.1007/s00262-018-2237-6. doi.org/10.1007/s00262-018-2237-6
- Lavezzo, E. , Franchin E., Ciavarella C., et al. 2020. “Suppression of a SARS‐CoV‐2 Outbreak in the Italian Municipality of Vo'.” Nature 584, no. 7821: 425–429. 10.1038/s41586-020-2488-1. doi.org/10.1038/s41586-020-2488-1
- Lebedin, M. , and de la Rosa K.. 2024. “Diversification of Antibodies: From V(D)J Recombination to Somatic Exon Shuffling.” Annual Review of Cell and Developmental Biology 40, no. 1: 265–281. 10.1146/annurev-cellbio-112122-030835. doi.org/10.1146/annurev-cellbio-112122-030835
- Lian, J. , Liu J., Yue Y., et al. 2019. “The Repertoire Features of T Cell Receptor β‐Chain of Different Age and Gender Groups in Healthy Chinese Individuals.” Immunology Letters 208: 44–51. 10.1016/j.imlet.2019.03.007. doi.org/10.1016/j.imlet.2019.03.007
- Loyal, L. , Braun J., Henze L., et al. 2021. “Cross‐Reactive CD4(+) T Cells Enhance SARS‐CoV‐2 Immune Responses Upon Infection and Vaccination.” Science 374, no. 6564: eabh1823. 10.1126/science.abh1823. doi.org/10.1126/science.abh1823
- Ma, S. , Wang C., Mao X., and Hao Y.. 2019. “B Cell Dysfunction Associated With Aging and Autoimmune Diseases.” Frontiers in Immunology 10: 318. 10.3389/fimmu.2019.00318. doi.org/10.3389/fimmu.2019.00318
- Mai, G. , Zhang C., Lan C., et al. 2023. “Characterizing the Dynamics of BCR Repertoire From Repeated Influenza Vaccination.” Emerging Microbes & Infections 12, no. 2: 2245931. 10.1080/22221751.2023.2245931. doi.org/10.1080/22221751.2023.2245931
- Martin, V. , Bryan W. Y. C., Kipling D., and Dunn‐Walters D.. 2015. “Ageing of the B‐Cell Repertoire.” Philosophical Transactions of the Royal Society of London. Series B, Biological Sciences 370, no. 1676: 20140237. 10.1098/rstb.2014.0237. doi.org/10.1098/rstb.2014.0237
- Mika, J. , Yoshida K., Kusunoki Y., Candéias S. M., and Polanska J.. 2023. “Sex‐ and Age‐Specific Aspects of Human Peripheral T‐Cell Dynamics.” Frontiers in Immunology 14: 1224304. 10.3389/fimmu.2023.1224304. doi.org/10.3389/fimmu.2023.1224304
- Moqri, M. , Herzog C., Poganik J. R., et al. 2023. “Biomarkers of Aging for the Identification and Evaluation of Longevity Interventions.” Cell 186, no. 18: 3758–3775. 10.1016/j.cell.2023.08.003. doi.org/10.1016/j.cell.2023.08.003
- Nikolich‐Žugich, J. 2018. “The Twilight of Immunity: Emerging Concepts in Aging of the Immune System.” Nature Immunology 19, no. 1: 10–19. 10.1038/s41590-017-0006-x. doi.org/10.1038/s41590-017-0006-x
- Parker, D. C. 1993. “T Cell‐Dependent B Cell Activation.” Annual Review of Immunology 11: 331–360. 10.1146/annurev.iy.11.040193.001555. doi.org/10.1146/annurev.iy.11.040193.001555
- Radak, Z. , Pan L., Zhou L., et al. 2024. “Epigenetic and ‘Redoxogenetic’ Adaptation to Physical Exercise.” Free Radical Biology & Medicine 210: 65–74. 10.1016/j.freeradbiomed.2023.11.005. doi.org/10.1016/j.freeradbiomed.2023.11.005
- Ritmahan, W. , Kesmir C., and Vroomans R. M. A.. 2020. “Revealing Factors Determining Immunodominant Responses Against Dominant Epitopes.” Immunogenetics 72, no. 1–2: 109–118. 10.1007/s00251-019-01134-9. doi.org/10.1007/s00251-019-01134-9
- Song, C. , Pan W., Brown B., et al. 2022. “Immune Repertoire Analysis of Normal Chinese Donors at Different Ages.” Cell Proliferation 55, no. 11: e13311. 10.1111/cpr.13311. doi.org/10.1111/cpr.13311
- Tabata, S. , Imai K., Kawano S., et al. 2020. “Clinical Characteristics of COVID‐19 in 104 People With SARS‐CoV‐2 Infection on the Diamond Princess Cruise Ship: A Retrospective Analysis.” Lancet Infectious Diseases 20, no. 9: 1043–1050. 10.1016/S1473-3099(20)30482-5. doi.org/10.1016/S1473-3099(20)30482-5
- Tan, L. , Wang Q., Zhang D., et al. 2020. “Lymphopenia Predicts Disease Severity of COVID‐19: A Descriptive and Predictive Study.” Signal Transduction and Targeted Therapy 5, no. 1: 33. 10.1038/s41392-020-0148-4. doi.org/10.1038/s41392-020-0148-4
- Tickotsky, N. , Sagiv T., Prilusky J., Shifrut E., and Friedman N.. 2017. “McPAS‐TCR: A Manually Curated Catalogue of Pathology‐Associated T Cell Receptor Sequences.” Bioinformatics 33, no. 18: 2924–2929. 10.1093/bioinformatics/btx286. doi.org/10.1093/bioinformatics/btx286
- Vita, R. , Mahajan S., Overton J. A., et al. 2019. “The Immune Epitope Database (IEDB): 2018 Update.” Nucleic Acids Research 47, no. D1: D339–D343. 10.1093/nar/gky1006. doi.org/10.1093/nar/gky1006
- Wang, H. , Chen Y., Feng L., et al. 2024. “A Gut Aging Clock Using Microbiome Multi‐View Profiles Is Associated With Health and Frail Risk.” Gut Microbes 16, no. 1: 2297852. 10.1080/19490976.2023.2297852. doi.org/10.1080/19490976.2023.2297852
- Williamson, E. J. , Walker A. J., Bhaskaran K., et al. 2020. “Factors Associated With COVID‐19‐Related Death Using OpenSAFELY.” Nature 584, no. 7821: 430–436. 10.1038/s41586-020-2521-4. doi.org/10.1038/s41586-020-2521-4
- Wu, M. , Zhao M., Wu H., and Lu Q.. 2021. “Immune Repertoire: Revealing the ‘Real‐Time’ Adaptive Immune Response in Autoimmune Diseases.” Autoimmunity 54, no. 2: 61–75. 10.1080/08916934.2021.1887149. doi.org/10.1080/08916934.2021.1887149
- Wu, T. D. , Madireddi S., de Almeida P. E., et al. 2020. “Peripheral T Cell Expansion Predicts Tumour Infiltration and Clinical Response.” Nature 579, no. 7798: 274–278. 10.1038/s41586-020-2056-8. doi.org/10.1038/s41586-020-2056-8
- Xu, J. , Li X. X., Yuan N., et al. 2023. “T Cell Receptor β Repertoires in Patients With COVID‐19 Reveal Disease Severity Signatures.” Frontiers in Immunology 14: 1190844. 10.3389/fimmu.2023.1190844. doi.org/10.3389/fimmu.2023.1190844
- Ye, B. , Smerin D., Gao Q., Kang C., and Xiong X.. 2018. “High‐Throughput Sequencing of the Immune Repertoire in Oncology: Applications for Clinical Diagnosis, Monitoring, and Immunotherapies.” Cancer Letters 416: 42–56. 10.1016/j.canlet.2017.12.017. doi.org/10.1016/j.canlet.2017.12.017
- Zhang, L. , Kandadi H., Yang H., et al. 2020. “Long‐Term Sculpting of the B‐Cell Repertoire Following Cancer Immunotherapy in Patients Treated With Sipuleucel‐T.” Cancer Immunology Research 8, no. 12: 1496–1507. 10.1158/2326-6066.CIR-20-0252. doi.org/10.1158/2326-6066.CIR-20-0252
- Zhang, L. , Mo S., Zhu X., et al. 2024. “Global Metabolomics Revealed Deviations From the Metabolic Aging Clock in Colorectal Cancer Patients.” Theranostics 14, no. 4: 1602–1614. 10.7150/thno.87303. doi.org/10.7150/thno.87303
- Zheng, B. , Yang Y., Chen L., Wu M., and Zhou S.. 2022. “B‐Cell Receptor Repertoire Sequencing: Deeper Digging Into the Mechanisms and Clinical Aspects of Immune‐Mediated Diseases.” iScience 25, no. 10: 105002. 10.1016/j.isci.2022.105002. doi.org/10.1016/j.isci.2022.105002
- Zhu, H. , Chelysheva I., Cross D. L., et al. 2023. “Molecular Correlates of Vaccine‐Induced Protection Against Typhoid Fever.” Journal of Clinical Investigation 133, no. 16: e169676. 10.1172/JCI169676. doi.org/10.1172/JCI169676
- Zhu, H. , Chen J., Liu K., et al. 2023. “Human PBMC scRNA‐Seq‐Based Aging Clocks Reveal Ribosome to Inflammation Balance as a Single‐Cell Aging Hallmark and Super Longevity.” Science Advances 9, no. 26: eabq7599. 10.1126/sciadv.abq7599. doi.org/10.1126/sciadv.abq7599
Republished from the open web under CC-BY. Authors: Gao X, Li SJ, Li J, Wang ZH, Zeng LT, Ma YQ, Dang YM, Zhang YM, Liu HL, Zhang LQ, Pang J, Cui J, Zhang TM, Cai JP. Read the original.