Designing polymer-peptide conjugates to target dipeptide repeat aggregates implicated in amyotrophic lateral sclerosis.
Toxic dipeptide repeats such as the aggregating glycine-alanine (GA) n peptide are implicated in the progression of amyotrophic lateral sclerosis (ALS), a lethal neuromuscular disease with an urgent need for new therapeutics. Here, we report polymer-peptide conjugates that prevent aggregation of (GA) 10 . Optical density measurements and transmission electron microscopy demonstrate that conjugates prevent aggregation when co-incubated with (GA) 10 and disperse pre-aggregated (GA) 10 . These results represent an important step toward a new generation of therapeutics for ALS and contribute to a growing body of literature demonstrating the potential of polymer-peptide conjugates as therapeutics.
Introduction
ALS, also known as Lou Gehrig's disease, is a lethal neuromuscular disease.1–3There were approximately 222 000 cases of ALS worldwide in 2015 and that number is estimated to increase by 69% to 376 000 cases by 2040.4Current treatment options include the drugs riluzole5and edaravone,6which slow ALS progression but fail to significantly extend patient survival,5,7highlighting the urgent need for new ALS therapies.
In 40–50% of familial and 5–10% of sporadic cases of ALS,8a mutation of theC9orf72gene results in a hexanucleotide expansion of guanine and cytosine. This particular hexanucleotide, GGGGCC, is typically repeated up to 23 times in healthy individuals, but in patients with ALS it is repeated hundreds or thousands of times.9,10This DNA alteration has multiple downstream effects, including: (a) the accumulation of repeating hexanucleotide RNA foci,10(b) the loss of the C9orf72 protein that would normally be encoded by this DNA,11and (c) the production of dipeptide repeat proteins (DPRs), including glycine–alanine (GA)n, glycine–arginine (GR)n, proline–arginine (PR)n, glycine–proline (GP)n, and proline–alanine (PA)n(Scheme 1).12,13
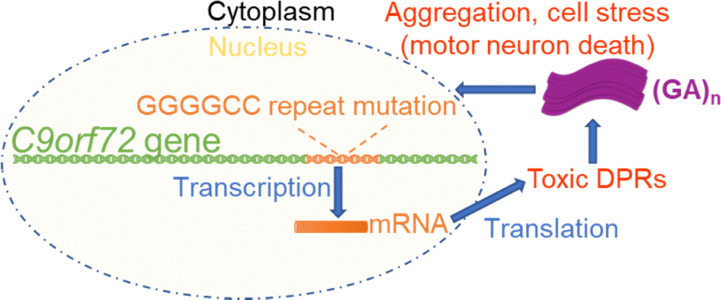
ALS-associated C9orf72 gene mutation. A hexanucleotide expansion of GGGGCC occurs within the gene, which, upon transcription and translation, results in aggregation of repeating hexanucleotide RNA foci, loss of C9orf72 protein, and translation of toxic DPRs, as shown here. Toxic (GA)nDPRs aggregate, capture proteins, and cause cellular stress, leading to motor neuron death.
While the full pathogenic mechanism of theC9orf72mutation is not yet fully understood, and may be a result of all three effects, there is a strong correlation between the (GA)nDPR and ALS. The (GA)nDPR is present in characteristic inclusions in the affected brain regions of patients with ALS14and is toxic in cell culture.15,16The toxicity of the (GA)nDPR may be attributable to the fact that, similar to the amyloid β protein implicated in Alzheimer's disease, (GA)nis an aggregating protein.16(GA)nDPRs form insoluble cytoplasmic aggregates that transmit between cells17and are toxic to cultured cells and primary neurons, including by toxic mechanisms such as autophagy abnormalities and endoplasmic reticulum (ER) stress.16,18,19Therefore, a method for eliminating aggregating (GA)nprovides a compelling therapeutic opportunity.
Recent therapeutic approaches focused on designing biologics to sequester or prevent the production of DPRs have had success in mitigating the deleterious hallmarks of ALS.17,20,21For example, antibodies engineered to target (GA)nreduced (GA)naggregation bothin vitroandin vivo17,20and, more recently, afforded favorable behavioral outcomes in ALS mouse models.20In addition, mice treated with antibodies had a significant increase in survival compared to untreated mice.20Antisense oligonucleotides targeting the DPR-coding RNA reduced levels of RNA foci and DPRs, which resulted in recovery from cognitive deficits in a mouse model.21
While the above examples highlight the transformative therapeutic potential of DPR sequestration for ALS patients, the use of biologics presents several key challenges including the time- and cost-intensive production processes,22,23batch-to-batch variability,24susceptibility to physicochemical alterations during manufacture and transport,25enzymatic degradation,22,25and the need for extensive use of cold chain that would hinder deployment of these treatments (particularly in developing countries).26
Inspired by the dispersion of amyloid β aggregates with synthetic peptide–polymer conjugates comprised of short amyloid β-derived peptide and water-soluble comb polymer,27–29here we employ a similar strategy to disperse (GA)nDPR aggregates (Scheme 2). Additionally, to leverage documented specific interactions betweenl-peptides (the stereochemical configuration that is naturally occurring) and theird-peptide enantiomers,30–32we investigate bothl- andd- peptides in the conjugates. While amyloid β and other amyloid-forming proteins have been extensively studied, (GA)nforms aggregates with properties distinct from model amyloids.33,34Short (GA)nDPRs (n= 3–6) aggregate as irregular fibrils and sheets,33whereas longer (n= 30) DPRs form fibrils, but unlike most amyloids do not bind Thioflavin.34These differences highlight the need for methods to disperse these unique aggregates.
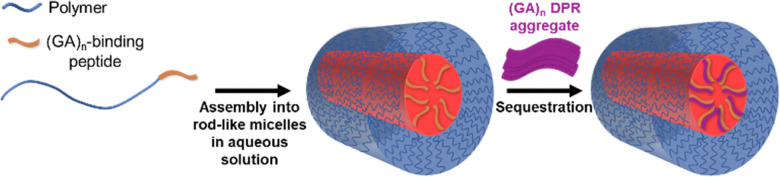
Proposed method to target (GA)nDPRs by interaction with a conjugate material composed of a (GA)n-targeting peptide attached to a polymer.
Results and discussion
(GA)10recapitulates the features of toxic (GA)nand is a suitable model toxic DPR
We began by synthesizing and characterizing a model (GA)nDPR ((GA)10) that will allow us to test methods of preventing aggregation and dispersing pre-formed aggregates. We selectedn= 10 repeats, since while the properties of (GA)nare length dependent, neural toxicity and aggregation was seen withn= 6,33andn= 10 was short enough to be synthesized using solid-phase methods and just soluble enough in aqueous solution (∼0.5 mg mL−1, 0.35 mM) to allow for solution characterization. Nuclear magnetic resonance (NMR) spectroscopy, matrix-assisted laser desorption ionization time-of-flight (MALDI-TOF) mass spectrometry, and high-performance liquid chromatography (HPLC) confirmed the primary structure and purity of (GA)10(Fig. S1). To confirm that (GA)10is of sufficient length to recapitulate the secondary structure and aggregation of native (GA)nspecies, we characterized (GA)10using Fourier-transform infrared spectroscopy (FTIR) and transmission electron microscopy (TEM). FTIR of (GA)10in both powder form (Fig. S2) and in 10 mM phosphate buffer (Fig. 1A) shows a strong peak in the amide I band region (1624 cm−1) characteristic of β-sheet formation.35As for aggregation, adding (GA)10at 3 mg mL−1(2.1 mM) to 10 mM phosphate buffer results in a visually turbid solution within seconds (Fig. S3). After incubation overnight, TEM shows amorphous aggregates (Fig. 1Band Fig. S4–S6). Yet, after 14 days, (GA)10forms more ordered, sheet-like aggregates like those reported for neurotoxic (GA)6(Fig. 1cand Fig. S16).33That (GA)10captures the β-sheet secondary structure content and aggregation behavior of neurotoxic DPRs suggests that (GA)10is a suitable model for toxic (GA)nDPRs.
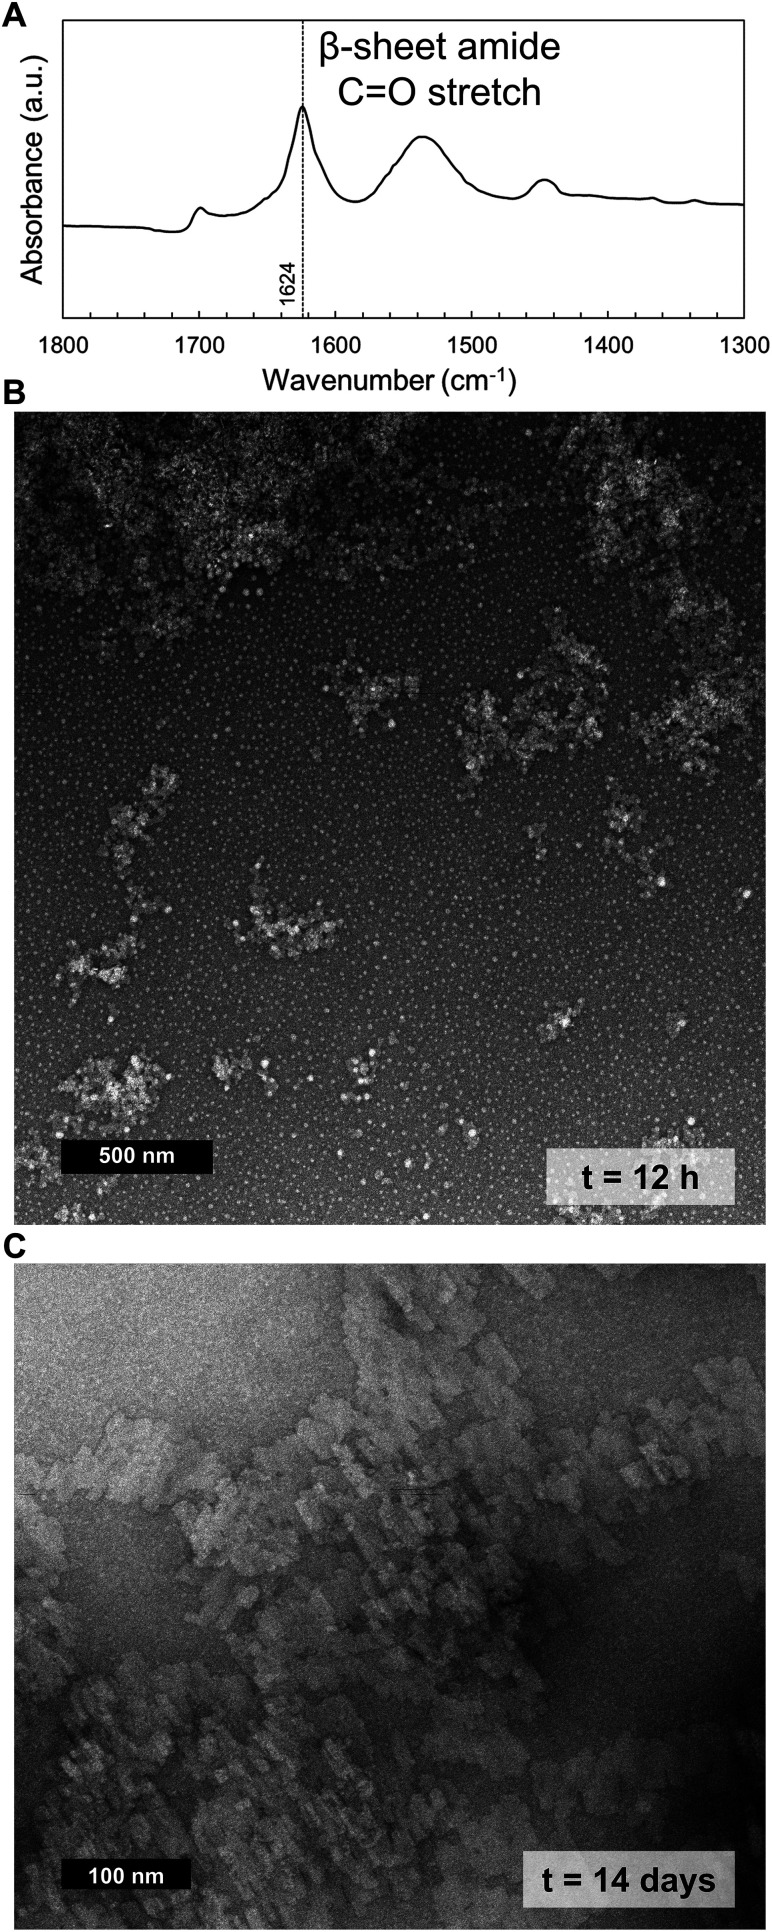
Characterization of the DPR model peptide (GA)10. (A) IR spectrum of 3 mg mL−1(GA)10in 10 mM phosphate buffer (pH 7.4) showing a characteristic β-sheet peak at 1624 cm−1. TEM image of (GA)10after (B) overnight and (C) 14 day incubation in 10 mM phosphate buffer. While initially amorphous, these aggregates become sheet-like over 14 days. Scale bars are 500 nm and 100 nm, respectively.
Design, synthesis, and characterization of (GA)n-targeting polymer–peptide conjugates
We designed (GA)n-targeting polymer–peptide conjugates to maximize interactions between the peptide component and (GA)n, while maintaining solubility and biocompatibility. Similar to the peptide on the amyloid β-dispersing conjugates,27–29which was taken from the hydrophobic region of the N-terminal domain of amyloid β,36,37we modelled our (GA)n-binding peptide off (GA)nitself, producing conjugates employing eitherd-orl-(GA)10as the peptide component. As the polymer component of our conjugates, we selected poly(ethylene glycol) (PEG) for its aqueous solubility and well-established safety profile, as evidenced by its use in multiple FDA-approved therapeutics.38–40We anticipated this combination of strongly interacting peptide and soluble polymer to sequester (GA)nDPRs without the conjugate becoming too hydrophobic and contributing to aggregation itself.36
To conjugate (GA)10to PEG, we employed a thiol-maleimide reaction (Fig. 2A). A thiol was added to (GA)10by addition of a cysteine residue at the N-terminus. We also included three glycine residues as a spacer to separate the (GA)10from the polymer and allow it to be more flexible. This resulted in a final sequence of H2N-CGGG-(GA)10-NH2. We note that a 2 : 1 molar ratio of thiol (peptide): maleimide (polymer) was required to push this reaction to completion (see Section S4 of the SI for more details). After the 1 h reaction, HPLC shows a reduction of the peptide peak, the disappearance of the polymer peak, and the appearance of two new peaks (Fig. 2B), one corresponding to the conjugate and one broad peak (from ∼7.2 min to 9 min) that could possibly be newly formed conjugate sequestering unreacted CGGG-(GA)10peptide in solution (see Fig. S7 and the associated discussion). We used preparative-scale HPLC to isolate the conjugate peak and confirmed it to be mPEG-CGGG-(GA)10conjugate by NMR spectroscopy (Fig. S8A). Size exclusion chromatography (SEC) and HPLC (Fig. S8B and C) confirmed conjugate purity. We produced bothl- andd-CGGG-(GA)10conjugates in this manner and characterized them by TEM following overnight incubation in 10 mM phosphate buffer (Fig. 2C, Fig. S9 and S10). The presence of a rod-like morphology throughout the sample suggests assembly of the conjugates into cylindrical micelles with a hydrophilic PEG exterior and a hydrophobic (GA)10interior.
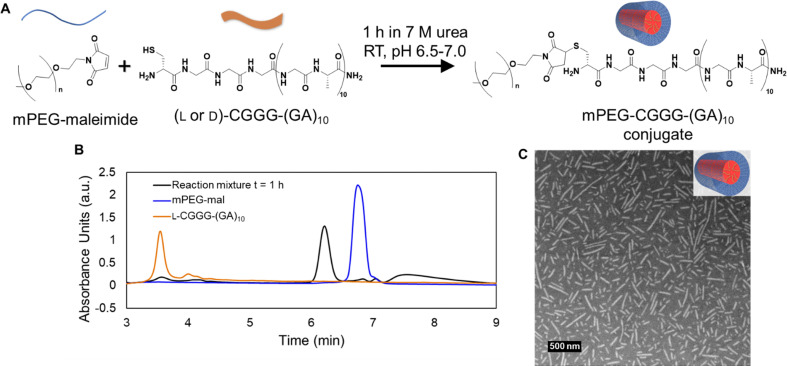
Synthesis and characterization of mPEG-CGGG-(GA)10conjugates. (A) Synthesis of mPEG-CGGG-(GA)10conjugatesviathiol-maleimide chemistry. (B) HPLC chromatogram showing the reaction mixture after 1 h (black trace), mPEG-mal alone (blue trace), andl-CGGG-(GA)10alone (orange trace). After 1 h of reaction, the largest peak in the reaction mixture (at 6.1 min) is a new peak, attributed to the newly formed conjugate, and elutes between the polymer peak and the peptide peak. The other major peak in the chromatogram, a very broad peak that elutes from 7.2 to 9 min, is attributed to conjugate product that interacts with unreacted peptide. (C) TEM image of mPEG-l-CGGG-(GA)10after overnight incubation in 10 mM phosphate buffer. A rod-like morphology is observed throughout the sample, suggesting as drawn in the inset a cylindrical micelle morphology for the conjugate.
Co-incubation of (GA)10with mPEG-CGGG-(GA)10conjugates leads to aggregate dispersal
We next tested the ability of our conjugates to prevent and reverse (GA)10aggregation by incubating (GA)10with either buffer or a solution containing conjugate. As a measure of aggregation, we used the optical density (OD) of suspensions over time to gauge turbidity by monitoring absorbance at 550 nm (Fig. 3). We settled on OD rather than fluorescence measurements that are also common for assessing amyloid-like peptide assemblies, since (GA)ndoes not always bind thioflavin T34and we found thioflavin T fluorescence served as a probe for total, rather than aggregated, (GA)10concentration (see Section S8 in the SI for more details).
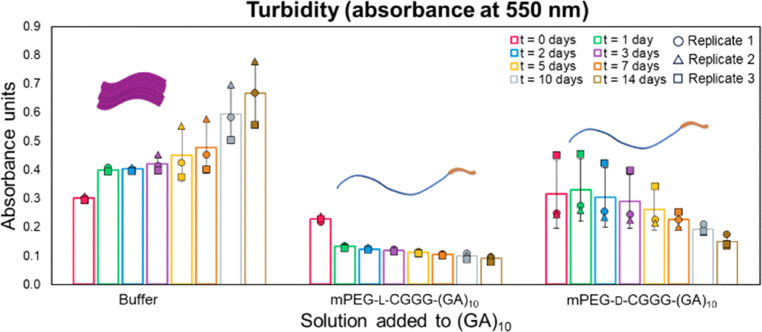
OD over time for (GA)10co-incubated with three different solutions: 10 mM phosphate buffer alone, mPEG-l-CGGG-(GA)10, and mPEG-d-CGGG-(GA)10(conjugate concentration = 1 mM). Incubating (GA)10in buffer alone, leads to OD that increases with time. The mPEG-l-CGGG-(GA)10solution led to a decrease in (GA)10OD with a sharp drop over the first day, followed by sustained lowered OD for the remainder of the experiment. Finally, the mPEG-d-CGGG-(GA)10solution initially yielded no change in OD, but after ∼7 days led to a decrease in OD.
We first sought to ensure that conjugate assembly or microbial growth in buffer did not increase OD. The absorbance of the conjugates alone in buffer is similar to that of buffer alone (Fig. S11), so despite assembly into nanoscale cylinders, the addition of conjugate to the suspension does not increase OD. To determine whether bacterial growth contributes to a rise in OD over the 14 day timespan of the aggregation experiments, we monitored the OD of a solution of 10 mM phosphate buffer for a duration of 28 days and did not observe an increase (Fig. S12).
As expected, adding 10 mM phosphate buffer to (GA)10powder yields continuous increases in OD and heterogeneity between vials over time due to aggregation. Similarly, when we incubate (GA)10with polymer alone, the OD continually increases with time (Fig. S13). However, when adding mPEG-l-CGGG-(GA)10conjugate to (GA)10(molar ratio of conjugate: (GA)10= 0.5) there is a sharp drop in OD over the first day, followed by sustained incremental decreases in OD over the 14 day experiment, demonstrating that the conjugate prevents aggregation.
Co-incubation of (GA)10with the mPEG-d-CGGG-(GA)10conjugate leads to higher average initial (t= 0) OD than the mPEG-l-CGGG-(GA)10conjugate. Despite starting with greater OD, thed-conjugate sample does still decrease in OD over time. Yet, while thel-conjugate treated sample dropped OD to ∼50% of itst= 0 value after just 1 day, thed-conjugate treated sample required 14 days to gradually drop to a similar ∼50% of its initial OD. This result may indicate different packing of thel- andd-stereochemistries, requiring different time scales forl-(GA)ndispersion. While requiring different time scales, these data indicate that both conjugates effectively prevent aggregation.
Morphological characterization supports that conjugates prevent (GA)10aggregation
At the beginning and end of the turbidity experiments, aliquots of each suspension were examined by TEM to investigate changes in the morphological characteristics of the (GA)10(Fig. 4and Fig. S15–S20). Immediately after adding (GA)10to buffer alone (t= 0 days), aggregation occurs, with TEM showing a mixture of small aggregates and larger structures that seem to be made up of groups of those smaller aggregates. To rule out the possibility that the structures were aggregates of the 10 mM phosphate buffer, we took TEM images of the buffer alone as a blank control and, as expected, saw no evidence of any structures formed (Fig. S4). After incubating (GA)10for 14 days in buffer alone, much larger aggregates (on the scale of hundreds to thousands of nm) form, consistent with the increasing OD of the suspension over time. For suspensions of (GA)10treated with conjugate att= 0 days, TEM showed both cylindrical structures consistent with the structures of the conjugates (Fig. 2C, Fig. S10, and S11) and some small aggregates consistent with those in images of (GA)10. After 14 days of incubation, we still observe a mixture of both conjugates and small aggregates for bothl- andd-conjugates, but there is nothing similar to the large-scale aggregation observed for the (GA)10incubated in buffer alone. The lack of larger aggregates after 14 days is encouraging, and together with the drop in OD over the same timeframe, suggests that the conjugates prevent aggregation of (GA)10.
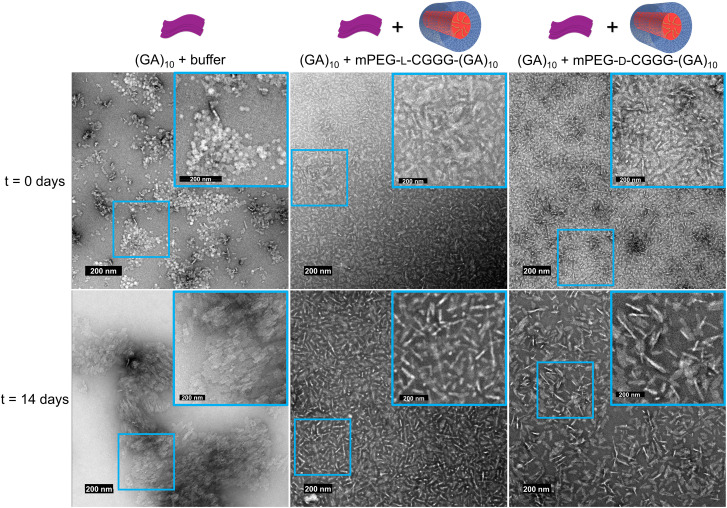
TEM images of (GA)10incubated in buffer alone or co-incubated with 7 mg mL−1mPEG-l-CGGG-(GA)10or 7 mg mL−1mPEG-d-CGGG-(GA)10immediately after incubation began and after 14 days of incubation. In the buffer treatment group, small aggregates of (GA)10are observed coming together to form larger aggregates at the beginning of the experiment, while at the end of the experiment much larger aggregates are observed. For both conjugate conditions, small (GA)10aggregates are observed at the beginning and end of the experiment, but the conjugate treatment prevents them from forming large-scale aggregates as observed for (GA)10incubated in buffer alone.
Dispersal of (GA)10in the presence of conjugates is concentration-dependent
To test the effects of conjugate concentration on (GA)10aggregation prevention and dispersal, we repeated the previous OD experiments, which were conducted with a 0.5 molar ratio of conjugate to (GA)10, and treated (GA)10withl-conjugate at higher and lower concentrations, yielding conjugate to molar ratios = 0.1 and 2.4 (Fig. 5). In an effort to capture data during the sharp drop in OD over the first 24 h when treating with mPEG-l-CGGG-(GA)10in the original experiment (Fig. 3), we monitored OD at earlier timepoints (t= 3 h,t= 6 h, andt= 12 h) in addition to some of the same later timepoints. The OD of (GA)10in buffer alone again increases over time and becomes more heterogeneous with time. Treating with 2.4× mPEG-l-CGGG-(GA)10to (GA)10prevented initial aggregation of (GA)10to a significant degree (p< 0.005), with the conjugate-treated sample having <50% of the initial OD of (GA)10in buffer and staying consistently low over 14 days. On the other hand, the initial OD of the (GA)10incubated with 0.5× molar equivalents of mPEG-l-CGGG-(GA)10is similar to the initial OD of the (GA)10incubated with buffer alone. However, the OD decreases with time to a final OD similar to that of the 2.4× treatment group. Finally, the OD of (GA)10incubated with the lowest concentration of conjugate (0.1× mPEG-l-CGGG-(GA)10to (GA)10) experienced a small increase in OD after 3 h, then remained at the same OD for the duration of the study. These data indicate a concentration-dependent response of (GA)10aggregation to mPEG-l-CGGG-(GA)10, where at high concentrations the conjugate prevents initial aggregation and intermediate and low concentrations of the conjugate prevent aggregate growth.
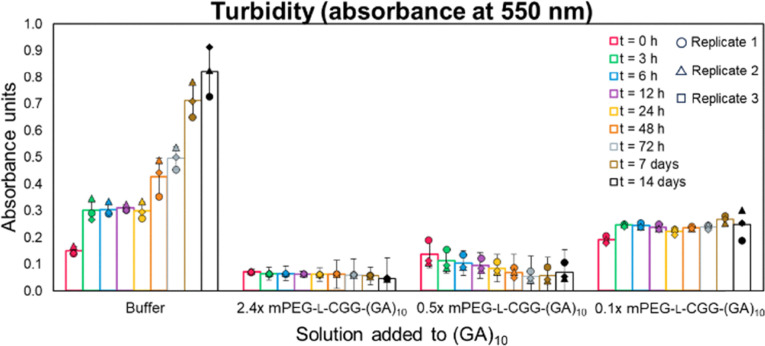
OD over time for (GA)10co-incubated with buffer or three different concentrations of mPEG-l-CGGG-(GA)10. As previously observed, the OD of the (GA)10incubated in buffer alone continually increases over time. The (GA)10treated with 35 mg mL−1mPEG-l-CGGG-(GA)10has low OD initially and remains low, indicating that it prevents most aggregation from occurring at all. The 7 mg mL−1mPEG-l-CGGG-(GA)10treatment condition has an initially higher OD that drops over time, indicating that aggregates are not able to grow in the presence of the conjugate. Finally, the (GA)10treated with 0.35 mg mL−1mPEG-l-CGGG-(GA)10starts with a higher OD than the other conditions and has an increase over the first 3 h. The OD in this treatment condition then remains stable for the next 14 days, suggesting that aggregates form and are not broken up, but the conjugate also does not allow them to continue growing as in the buffer condition.
Incubation of mPEG-CGGG-(GA)10conjugates with pre-aggregated (GA)10
To better reflect the disease state in ALS, we allowed (GA)10to first aggregate in buffer for 7 days before applying polymer controls (PEG-methyl ether, PEG-ME) or conjugate (mPEG-l-CGGG-(GA)10or mPEG-d-CGGG-(GA)10) in powder form. In these experiments, we used a 0.5× conjugate: (GA)10molar ratio. The OD of the solutions was monitored for 28 days after adding PEG-ME or conjugate to observe the continued aggregation behavior of (GA)10(Fig. 6). As expected, the (GA)10incubated in buffer alone or with PEG-ME alone continued to aggregate over time. The two samples treated with conjugate increased in OD over the first 2 days, but thereafter the OD decreased. Whereas initial co-incubation (Fig. 3) showed difference in treating with mPEG-l-CGGG-(GA)10and mPEG-d-CGGG-(GA)10, here the two conjugate treatments lead to very similar decreases in (GA)10aggregation. The differences between the two control groups (buffer and PEG-ME alone) and the two treatment groups are clear, with aggregation going unchecked in the control groups whereas aggregation initially accelerates but then slows and reverses for the treatment groups. This is supported by calculating a percent change in OD fromt= 0 days after pre-aggregation tot= 28 days after pre-aggregation. The (GA)10treated with buffer experienced a 141% increase in OD over this time period, the (GA)10treated with PEG-ME experienced a 99% increase in OD, the (GA)10treated with mPEG-l-CGGG-(GA)10experienced a 49% decrease in OD, and the (GA)10treated with mPEG-d-CGGG-(GA)10experienced a 37% decrease in OD. Thus, while our other experiments show that we can prevent aggregation, these experiments show that we can begin to reverse it as well.
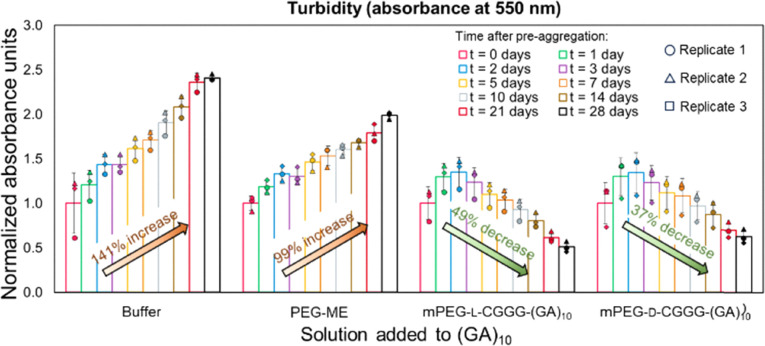
Turbidity over time for pre-aggregated (GA)10. (GA)10was allowed to aggregate for 7 days, then treated with either no further additives (‘buffer’), 7 mg mL−1PEG-ME, or 7 mg mL−1mPEG-l-CGGG-(GA)10, or 7 mg mL−1mPEG-d-CGGG-(GA)10, corresponding to a conjugate: (GA)10molar ratio = 0.5. The time indicates the days since treatment addition, rather than total days of aggregation. The (GA)10incubated with buffer or treated with PEG-ME continually increase in turbidity over time. However, the (GA)10suspensions treated with mPEG-l-CGGG-(GA)10or mPEG-d-CGGG-(GA)10increase in turbidity for the first two days, then decrease in turbidity over 28 days to levels well below the turbidity after pre-aggregation, indicative of the conjugates breaking up the aggregates that formed. Arrows indicate the percent change in turbidity fromt= 0 days after pre-aggregation tot= 28 days after pre-aggregation for each solution.
In an analogous manner to the co-incubation OD study, we acquired TEM images at the beginning (i.e., after pre-aggregation and before adding polymer or conjugate) and end of the experiment (28 days) (Fig. 7and Fig. S21–S25). After the pre-aggregation period, (GA)10formed small aggregates and larger clusters of aggregates (Fig. 7A), then when left untreated for 28 days formed larger-scale aggregates (Fig. 7B). The (GA)10treated with just PEG-ME had a similar morphology to the (GA)10that was incubated in buffer alone (Fig. 7C). Images of the two conjugate-treated suspensions after 28 days (Fig. 7D and E) showed some small aggregates, but no evidence of the larger-scale (GA)10aggregates observed for the (GA)10incubated in PEG-ME or buffer.
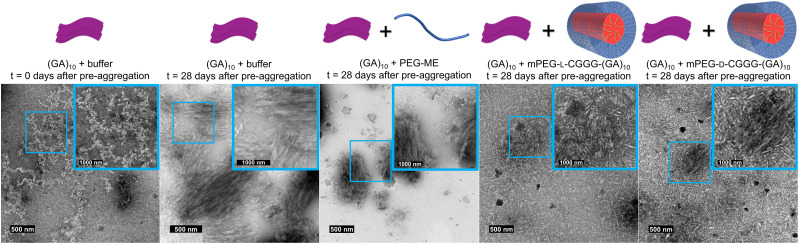
TEM images of (A) (GA)10at the end of the 7-day pre-aggregation period for comparison to (B) pre-aggregated (GA)10incubated in buffer alone, (C) with PEG-ME, (D) with mPEG-l-CGGG-(GA)10, and (E) with mPEG-d-CGGG-(GA)1028 days after the 7 day pre-aggregation period. Matching the trends in the OD data, (GA)10incubated in buffer or PEG-ME forms larger-scale aggregates, while (GA)10incubated in mPEG-l-CGGG-(GA)10or mPEG-d-CGGG-(GA)10show no evidence of similar larger-scale aggregates.
Conclusions
This work introduces a synthetic system designed to target and reduce aggregation of toxic, aggregating (GA)nDPRs that are implicated in amyotrophic lateral sclerosis. Polymer–peptide conjugates with a hydrophilic PEG polymer component and a hydrophobic (GA)10peptide component not only stop the aggregation of a model DPR, (GA)10, but also disperse pre-formed aggregates. This is supported by decreases in the OD of (GA)10suspensions incubated withd-orl-conjugates over time, whereas the OD of (GA)10solutions incubated with polymer alone or buffer alone increases over time. Additionally, TEM images reveal significant morphological differences, with more extensive aggregation for (GA)10incubated in buffer or with polymer alone compared to (GA)10incubated with conjugates.
The successful dispersion of (GA)10by these polymer–peptide conjugates mirrors the dispersion of Amyloid β by previously reported poly(HPMA)-peptide conjugates.27,28,37Taken together, these data suggest that polymer–peptide conjugates, where the polymer is hydrophilic and biocompatible and the peptide binds to a protein of interest, may be a generalizable platform for targeting and sequestering proteins. In fact, this approach could be employed to target other toxic DPRs such as (GR)nand (PR)nin future studies, testing the generalizability of the approach beyond amyloid-like proteins.
While we expected that using conjugates withd-peptides might be more effective than conjugates withl-peptides due to previous reports of β-sheet peptides that form stronger interactions between thedandl-enantiomers, we observed a faster drop in OD for thel-conjugates in our co-incubation study, and little difference in the effectiveness of ourd- andl-conjugates in preventing and dispersing aggregation in the pre-aggregation study. This suggests thatd- andl-(GA)ndo not interact specifically in the same way thatd- andl-peptides studied in previous reports do. These data represent a unique middle ground where thed-peptides in the conjugate clearly interact with thel-(GA)10, but do not interact more strongly thanl-conjugates. In previous examples with other peptide systems, heterochiral interactions are typically either stronger than homochiral or do not occur at all; the unique interaction betweend- andl-(GA)10deserves further investigation to further elucidate the design rules for stereochemistry-directed interactions. Moreover, since bothd- andl-conjugates capably disperse aggregates, thed- conjugates can be used if enhanced proteolytic stability is desired sinced-peptides resist proteolytic degradation.
Encouragingly, this study furnishes two conjugates capable of dispersing disease state-mimicking aggregates of (GA)10. While future directions include investigating the role of polymer chemistry and architecture, peptide length, and efficacy in dispersing aggregates of longer (GA)nin biological systems, the design of a synthetic therapeutic that is effective at both preventing and disrupting ALS-associated aggregation is a crucial step toward optimizing ALS therapeutics that are less difficult/expensive to produce and less cold chain-dependent than current biologics.
Materials and methods
Materials
Potassium phosphate dibasic (≥98%), potassium phosphate monobasic (≥99.0%), sodium hydroxide (NaOH, 97%) pellets, acetonitrile (HPLC grade), trifluoracetic acid (TFA, 99%), hydrochloric acid (37 wt%), dimethylformamide (DMF, ≥99.8%), diethyl ether (≥99.0%, contains butylated hydroxytoluene as inhibitor), triisopropylsilane (98%), piperidine (≥99%), 2,2′-(ethylenedioxy)diethanethiol (95%), diisopropyl carbodiimde (99%), and methoxypolyethylene glycol maleimide 5000 (≥90%), were purchased from Sigma-Aldrich. Urea (99.0–100.5%) was purchased from Avantor. Rink resin SS (0.51 mmol g−1loading, 100–200 mesh, 1% divinylbenzene), Fmoc-Gly-OH, Fmoc-Ala-OH, Fmoc-d-Ala-OH, Fmoc-Cys(Trt)-OH, Fmoc-d-Cys(Trt)-OH, and Oxyma Pure were purchased from Advanced ChemTech. Water purified by reverse osmosis (RO water) was obtained from an in-house supply and ultrapure water (18.2 MΩ cm) was obtained from a Thermo Scientific Smart2Pure water purification system. All chemicals were used without further purification.
Peptide synthesis
(GA)10, (GA)20,l-CGGG-(GA)10, andd-CGGG-(GA)10were synthesized on a CEM Corporation Liberty Blue automated, microwave-assisted peptide synthesizer. Synthesis was performed using standard Fmoc methods on a Rink amide resin SS (0.5 mmol g−1substitution, 100–200 mesh, 1% divinylbenzene, Advanced ChemTech). First, the resin was swelled in DMF for 5 min, then two “dummy coupling” steps were performed, designed to add DMF to the reaction vessel and heat to 90 °C like a normal coupling method. These dummy couplings ensure that the instrument is fully warmed up and consistently hitting the target temperature before the actual coupling methods begin. To grow the chain, Fmoc-protected amino acids are added to the reaction vessel and the Fmoc protecting group is removed using 20% (v/v) piperidine in DMF. The coupling reaction is then performed by adding diisopropyl carbodiimide (1 M in DMF) and Oxyma Pure (1 M in DMF) to the reaction vessel and heating to 90 °C for 2 min. The same steps for Fmoc removal and coupling are repeated until the peptide is built from C-terminus to N-terminus.
The peptides were cleaved from the resin and Trt side chain protecting groups were removed from the Cys residuesviaa 3 h, room temperature reaction in a solution of 92.5% TFA, 2.5% triisopropylsilane, 2.5% 2,2′-(ethylenedioxy)diethanethiol, and 2.5% deionized water. Following the reaction, the mixture was precipitated in cold ether and centrifuged (4816 ×gfor 5 min at 4 °C) to obtain a peptide pellet. This pellet was suspended once more in cold ether and centrifuged under the same conditions, before being dried under vacuum for 45 min. Dried peptides were dissolved in RO water, frozen in liquid nitrogen, lyophilized, and stored as powders at −20 °C.
Nuclear magnetic resonance (NMR) spectroscopy
Peptides or conjugates were dissolved at 5–7 mg mL−1in deuterium oxide (D2O) or deuterated dimethyl sulfoxide (DMSO-d6).1H NMR spectroscopy was conducted on a 600 MHz Bruker Avance III spectrometer equipped with a 5 mm HCN Zpfg probe. Chemical shifts were referenced to the solvent residual peak (either 2.50 or 4.79 ppm for DMSO-d6 or D2O, respectively).
Matrix-assisted laser desorption/ionization (MALDI) time-of-flight (TOF) mass spectrometry
MALDI-TOF samples were prepared in RO water at a concentration of ∼1 mg mL−1. Samples were mixed 1 : 1 v/v with a 5 mg mL−1solution of cyano-4-hydroxycinnamic acid (CHCA) matrix prepared in 70% (v/v) acetonitrile in water + 0.1% TFA by pipetting up and down 6 times (2 µL of sample + 2 µL of CHCA matrix). A 2 µL aliquot of this solution was pipetted onto a FlexiMass SR48 target plate (Shimadzu) and dried at room temperature. The dried sample was loaded into a Shimadzu 8030 MALDI-TOF instrument, which was calibrated using MALDI TOFMix (LaserBio Labs) calibrant before every use.
Analytical-scale high performance liquid chromatography (HPLC)
(GA)10was dissolved at 0.5 mg mL−1in HPLC solvent (95% ultrapure water + 0.1% TFA, 5% acetonitrile + 0.1% TFA) and double filtered (0.45 µm polytetrafluoroethylene membranes, 13 mm, VWR) to obtain a clear solution and remove aggregates.d-andl-CGGG-(GA)10were dissolved at 1 mg mL−1in HPLC solvent and double filtered to obtain a clear solution. Samples were loaded into 2 mL vials and HPLC was performed on a Waters Alliance e2695 HPLC system with a 2998 photodiode array detector with separation achieved using an XBridge C18 reverse-phase column (4.6 × 75 mm, 3.5 µm particle size). Peptides were eluted using a 1 mL min−1linear gradient from 5–95% (v/v) acetonitrile + 0.1% TFA in water + 0.1% TFA over 9 min with the column operating at 35 °C. Elution was monitored by absorbance at 214 nm.
Conjugation of CGGG-(GA)10peptides to poly(ethylene glycol)
A thiol-maleimide reaction was used to conjugated- orl-CGGG-(GA)10to poly(ethylene glycol) (PEG). Both peptide and polymer were dissolved at a concentration of 1 mM in 7 M urea dissolved in ultrapure water, where urea (a known denaturant)41supports solubilization. Each sample was vortexed for 30 s and sonicated in a sonication bath for 15 s to fully dissolve the peptide or polymer. The pH was then adjusted to 6.5–6.9 for both solutions using 1–5 µL of 1 M NaOH(aq)or 1 M HCl(aq). The pH was kept in this range to favor the thiol-maleimide reaction over an amine-maleimide reaction that becomes more favorable at higher pH. Peptide and polymer solutions were mixed at a volume ratio of 2 : 1 peptide: polymer (6.6 mL of peptide solution to 3.3 mL of polymer solution) to drive the reaction to completion (see Appendix C4.1). The mixture was stirred for 30 s on a Heidolph Hei-plate magnetic stir plate before the pH was checked again to ensure it remained between 6.5–6.9. The reaction mixture was allowed to stir for 1 h at room temperature.
mPEG-CGGG-(GA)10conjugate purification by preparative-scale HPLC
After 1 h of reaction, the reaction mixture described above was double filtered and directly loaded into the injection loop of a Waters 2545 HPLC system with an attached 2489 photodiode array detector and Waters Fraction Collector III collection system. The mixture was separated on an XBridge C18 reverse-phase column (30 × 150 mm, 5 µm particle size) using a gradient from 5% to 30% acetonitrile in water + 0.1% TFA from 2.22 to 4 min and 30% to 60% acetonitrile in water + 0.1% TFA from 4 min to 18 min. Fractions of eluent were collected in glass culture tubes (13 × 100 mm, VWR) and fractions that eluted from the desired peak were combined and lyophilized. The powders obtained from lyophilization were stored at −20 °C.
Optical density turbidity experiments: co-incubation
For OD experiments, peptide powder (3.6 mg, 2.8 µmol) was added to 7 mL vials. Separately, solutions of polymer or conjugate were prepared at concentrations of 35, 7, or 0.35 mg mL−1and vortexed to dissolve. To start the experiment, 1.2 mL of buffer, polymer, or conjugate solution was added to the vials containing peptide. Thus, the conjugate solutions prepared at 35, 7, or 0.35 mg mL−1yielded final molar ratios of conjugate: (GA)10DPR molar ratios of approximately 0.02, 0.5, and 2.4, respectively. A stir bar (either 4.3 × 9.4 mm egg-shaped or 3.1 × 12.7 mm cylindrical) was added and solutions were stirred at 300 rpm on a Heidolph Hei-plate magnetic stir plate at room temperature. At the designated timepoints, 3 aliquots of 200 µL were added to a 96 well plate from each vial. Absorbance at 550 nm was measured on a Tecan Infinite M Plex plate reader. After the absorbance measurement, the 200 µL aliquots were returned to stirring in their original vials until the next timepoint. The values reported are the average of three 200 µL aliquots per vial subtracted by the average absorbance of three 200 µL aliquots of 10 mM phosphate buffer.
Optical density turbidity experiments: pre-aggregation
The OD experiments probing pre-aggregation were conducted in the same way as the co-incubation experiments, with the exception that 1.2 mL of buffer was added to all vials of peptide. From that time, the solutions were stirred under the same conditions for 7 days to allow (GA)10to aggregate in buffer in the absence of polymer or conjugate treatments. After 7 days of incubation in buffer, polymer or conjugate (molar ratio conjugate: (GA)10= 0.5) was added directly to the vials in powder form. The values reported are the average of three 200 µL aliquots per vial subtracted by the average absorbance of three 200 µL aliquots of 10 mM phosphate buffer.
Thioflavin T fluorescence
For (GA)10thioflavin T fluorescence, we prepared (GA)10solutions at 3, 1.5, 0.75, 0.35, 0.15, and 0.04 mg mL−1in 10 mM phosphate buffer. Each solution was prepared separately rather than by dilution because (GA)10is not fully soluble at all of these concentrations, so a dilution would not be reliable. We then prepared a 10 mM stock solution of thioflavin T and diluted the stock solution into each (GA)10solution to yield a final concentration of 10 µM thioflavin T in each vial. The vials were stirred for 75 min, then fluorescence was measured on a Tecan Infinite M Plex plate reader with an excitation wavelength of 450 nm and an emission wavelength of 482 nm.
For thioflavin T fluorescence measured during the OD study, we prepared a fresh stock solution of thioflavin T at 1 mM for each day a measurement was taken, then diluted this stock to 100 µM. After absorbance at 550 nm was measured for OD, 20 µL of the 100 µM stock solution was added to each 200 µL well in the 96 well plate, for a final concentration of 10 µM thioflavin T in each well. Fluorescence was measured at the same timepoints as the OD experiment on a Tecan Infinite M Plex plate reader with an excitation wavelength of 450 nm and an emission wavelength of 482 nm.
TEM imaging
To monitor morphological changes during the OD experiment, 10 µL aliquots were taken from one of the vials prepared at each condition at the same timepoints as the OD experiments. Aliquots were stored at −20 °C until sample grids were ready to be prepared. Carbon-coated copper grids (300 mesh, Electron Microscopy Sciences), were pretreated in a plasma cleaner with 20% v/v O2(g)and 80% v/v Ar(g)for 30 s. To apply the samples to the grids, 3 µL of sample were pipetted onto the grids and left for 1 min. To wick away excess solution, filter paper was placed at the edge of the grid, and washed three times by applying and then wicking away 10 µL of RO water. Washed grids were dried for 1 min before adding 3 µL of 2% aqueous uranyl acetate staining solution for 1 min. Excess uranyl acetate solution was wicked away with filter paper, and the samples were air dried. Samples were imaged on an FEI Titan instrument operating at an accelerating voltage of 120 kV at magnifications ranging from 8100× to 34 000×.
Author contributions
V. G., Z. C., M. K., and R. L. conceived the idea and designed experiments. V. G., Z. C., and M. K. conducted experiments and associated analysis. V. G. and R. L. wrote the manuscript with input from all authors. R. L. acquired funding and supervised the work.
Conflicts of interest
There are no conflicts to declare.
References
- TaylorJ. P. BrownR. H. ClevelandD. W. Nature2016539197206 doi.org/10.1038/nature20413
- SimmonsZ. Neurotherapeutics201512394402 doi.org/10.1007/s13311-014-0322-x
- Al-chalabiA. HardimanO. Nat. Rev. Neurol. 20139617628 doi.org/10.1038/nrneurol.2013.203
- ArthurK. C. CalvoA. PriceT. R. GeigerJ. T. ChiòA. TraynorB. J. Nat. Commun. 2016712408 doi.org/10.1038/ncomms12408
- MillerR. G. MitchellJ. D. LyonM. MooreD. H. Cochrane Database Syst. Rev. 2012CD001447 doi.org/10.1002/14651858.CD001447
- AbeK. AokiM. TsujiS. ItoyamaY. SobueG. TogoM. HamadaC. TanakaM. AkimotoM. NakamuraK. TakahashiF. KondoK. YoshinoH. AbeK. AokiM. TsujiS. ItoyamaY. SobueG. TogoM. HamadaC. SasakiH. YabeI. DoiS. WaritaH. ImaiT. ItoH. FukuchiM. OsumiE. WadaM. NakanoI. MoritaM. OgataK. MarukiY. ItoK. KanoO. YamazakiM. TakahashiY. IshiuraH. OginoM. KoikeR. IshidaC. UchiyamaT. MizoguchiK. ObiT. WatanabeH. AtsutaN. AibaI. TaniguchiA. SawadaH. HazamaT. FujimuraH. KusakaH. KuniedaT. KikuchiH. MatsuoH. UeyamaH. UekawaK. TanakaM. AkimotoM. UedaM. MurakamiA. SumiiR. KudouT. NakamuraK. MorimotoK. YoneokaT. HiraiM. SasakiK. TeraiH. NatoriT. MatsuiH. KotaniK. YoshidaK. IwasakiT. TakahashiF. KondoK. YoshinoH. Lancet Neurol. 201716505512 doi.org/10.1016/S1474-4422(17)30115-1
- MillerR. G. AppelS. H. Amyotroph. Lateral Scler. Frontotemporal Degener. 20171814 doi.org/10.1080/21678421.2017.1361447
- MajounieE. RentonA. E. MokK. DopperE. G. P. WaiteA. RollinsonS. ChiòA. RestagnoG. NicolaouN. Simon-SanchezJ. van SwietenJ. C. AbramzonY. JohnsonJ. O. SendtnerM. PamphlettR. OrrellR. W. MeadS. SidleK. C. HouldenH. RohrerJ. D. MorrisonK. E. PallH. TalbotK. AnsorgeO. HernandezD. G. ArepalliS. SabatelliM. MoraG. CorboM. GianniniF. CalvoA. EnglundE. BorgheroG. FlorisG. L. RemesA. M. LaaksovirtaH. McCluskeyL. TrojanowskiJ. Q. Van DeerlinV. M. SchellenbergG. D. NallsM. A. DroryV. E. LuC. S. YehT. H. IshiuraH. TakahashiY. TsujiS. Le BerI. BriceA. DrepperC. WilliamsN. KirbyJ. ShawP. HardyJ. TienariP. J. HeutinkP. MorrisH. R. Pickering-BrownS. TraynorB. J. Lancet Neurol. 201211323330 doi.org/10.1016/S1474-4422(12)70043-1
- RentonA. E. MajounieE. WaiteA. Simón-SánchezJ. RollinsonS. GibbsJ. R. SchymickJ. C. LaaksovirtaH. van SwietenJ. C. MyllykangasL. KalimoH. PaetauA. AbramzonY. RemesA. M. KaganovichA. ScholzS. W. DuckworthJ. DingJ. HarmerD. W. HernandezD. G. JohnsonJ. O. MokK. RytenM. TrabzuniD. GuerreiroR. J. OrrellR. W. NealJ. MurrayA. PearsonJ. JansenI. E. SondervanD. SeelaarH. BlakeD. YoungK. HalliwellN. CallisterJ. B. ToulsonG. RichardsonA. GerhardA. SnowdenJ. MannD. NearyD. NallsM. A. PeuralinnaT. JanssonL. IsoviitaV. M. KaivorinneA. L. Hölttä-VuoriM. IkonenE. SulkavaR. BenatarM. WuuJ. ChiòA. RestagnoG. BorgheroG. SabatelliM. HeckermanD. RogaevaE. ZinmanL. RothsteinJ. D. SendtnerM. DrepperC. EichlerE. E. AlkanC. AbdullaevZ. PackS. D. DutraA. PakE. HardyJ. SingletonA. WilliamsN. M. HeutinkP. Pickering-BrownS. MorrisH. R. TienariP. J. TraynorB. J. Neuron201172257268 doi.org/10.1016/j.neuron.2011.09.010
- DeJesus-HernandezM. MackenzieI. R. BoeveB. F. BoxerA. L. BakerM. RutherfordN. J. NicholsonA. M. FinchN. C. A. FlynnH. AdamsonJ. KouriN. WojtasA. SengdyP. HsiungG. Y. R. KarydasA. SeeleyW. W. JosephsK. A. CoppolaG. GeschwindD. H. WszolekZ. K. FeldmanH. KnopmanD. S. PetersenR. C. MillerB. L. DicksonD. W. BoylanK. B. Graff-RadfordN. R. RademakersR. Neuron201172245256 doi.org/10.1016/j.neuron.2011.09.011
- WaiteA. J. BäumerD. EastS. NealJ. MorrisH. R. AnsorgeO. BlakeD. J. Neurobiol. Aging2014351779 doi.org/10.1016/j.neurobiolaging.2014.01.016
- ZuT. GibbensB. DotyN. S. Gomes-PereiraM. HuguetA. StoneM. D. MargolisJ. PetersonM. MarkowskiT. W. IngramM. A. C. NanZ. ForsterC. LowW. C. SchoserB. SomiaN. V. ClarkH. B. SchmechelS. BittermanP. B. GourdonG. SwansonM. S. MoseleyM. RanumL. P. W. Proc. Natl. Acad. Sci. U. S. A. 2011108260265 doi.org/10.1073/pnas.1013343108
- ZuT. LiuY. Bañez-CoronelM. ReidT. PletnikovaO. LewisJ. MillerT. M. HarmsM. B. FalchookA. E. SubramonyS. H. OstrowL. W. RothsteinJ. D. TroncosoJ. C. RanumL. P. W. Proc. Natl. Acad. Sci. U. S. A. 2013110E4968E4977 doi.org/10.1073/pnas.1315438110
- QuaegebeurA. GlariaI. LashleyT. IsaacsA. M. Acta Neuropathol. Commun. 20208184 doi.org/10.1186/s40478-020-01036-y
- ZhangY. J. GendronT. F. GrimaJ. C. SasaguriH. Jansen-WestK. XuY. F. KatzmanR. B. GassJ. MurrayM. E. ShinoharaM. LinW. L. GarrettA. StankowskiJ. N. DaughrityL. TongJ. PerkersonE. A. YueM. ChewJ. Castanedes-CaseyM. KurtiA. WangZ. S. LiesingerA. M. BakerJ. D. JiangJ. Lagier-TourenneC. EdbauerD. ClevelandD. W. RademakersR. BoylanK. B. BuG. LinkC. D. DickeyC. A. RothsteinJ. D. DicksonD. W. FryerJ. D. PetrucelliL. Nat. Neurosci. 201619668677 doi.org/10.1038/nn.4272
- ZhangY. J. Jansen-WestK. XuY. F. GendronT. F. BieniekK. F. LinW. L. SasaguriH. CaulfieldT. HubbardJ. DaughrityL. ChewJ. BelzilV. V. PrudencioM. StankowskiJ. N. Castanedes-CaseyM. WhitelawE. AshP. E. A. DeTureM. RademakersR. BoylanK. B. DicksonD. W. PetrucelliL. Acta Neuropathol. 2014128505524 doi.org/10.1007/s00401-014-1336-5
- ZhouQ. LehmerC. MichaelsenM. MoriK. AlteraugeD. BaumjohannD. SchludiM. H. GreilingJ. FarnyD. FlatleyA. FeederleR. MayS. SchreiberF. ArzbergerT. KuhmC. KlopstockT. HermannA. HaassC. EdbauerD. EMBO Mol. Med. 20179687702 doi.org/10.15252/emmm.201607054
- KhosraviB. HartmannH. MayS. MöhlC. EderleH. MichaelsenM. SchludiM. H. DormannD. EdbauerD. Hum. Mol. Genet. 201726790800 doi.org/10.1093/hmg/ddw432
- DarlingA. L. BreydoL. RivasE. G. GebruN. T. ZhengD. BakerJ. D. BlairL. J. DickeyC. A. KorenJ. UverskyV. N. Int. J. Biol. Macromol. 2019127136145 doi.org/10.1016/j.ijbiomac.2019.01.035
- NguyenL. MontrasioF. PattamattaA. TusiS. K. BardhiO. MeyerK. D. HayesL. NakamuraK. Banez-CoronelM. CoyneA. GuoS. LaboissonniereL. A. GuY. NarayananS. SmithB. NitschR. M. KankelM. W. RusheM. RothsteinJ. ZuT. GrimmJ. RanumL. P. W. Neuron2020105645662 doi.org/10.1016/j.neuron.2019.11.007
- JiangJ. ZhuQ. GendronT. F. SaberiS. McAlonis-DownesM. SeelmanA. StaufferJ. E. Jafar-nejadP. DrennerK. SchulteD. ChunS. SunS. LingS. C. MyersB. EngelhardtJ. KatzM. BaughnM. PlatoshynO. MarsalaM. WattA. HeyserC. J. ArdM. C. De MuynckL. DaughrityL. M. SwingD. A. TessarolloL. JungC. J. DelpouxA. UtzschneiderD. T. HedrickS. M. de JongP. J. EdbauerD. Van DammeP. PetrucelliL. ShawC. E. BennettC. F. Da CruzS. RavitsJ. RigoF. ClevelandD. W. Lagier-TourenneC. Neuron201690535550 doi.org/10.1016/j.neuron.2016.04.006
- ChamesP. Van RegenmortelM. WeissE. BatyD. Br. J. Pharmacol. 2009157220233 doi.org/10.1111/j.1476-5381.2009.00190.x
- MakurvetF. D. Med. Drug Discovery20219100075 doi.org/10.1016/j.medidd.2020.100075
- VultoA. G. JaquezO. A. Rheumatology201756iv14iv29 doi.org/10.1093/rheumatology/kex278
- AwwadS. AngkawinitwongU. Pharmaceutics201810124 doi.org/10.3390/pharmaceutics10030083
- YuY. B. BriggsK. T. TarabanM. B. BrinsonR. G. MarinoJ. P. Pharm. Res. 20213837 doi.org/10.1007/s11095-021-03008-w
- SongY. ChengP. -N. ZhuL. MooreE. G. MooreJ. S. J. Am. Chem. Soc. 201413652335236 doi.org/10.1021/ja501102f
- SongY. MooreE. G. GuoY. MooreJ. S. J. Am. Chem. Soc. 201713942984301 doi.org/10.1021/jacs.7b00289
- JiangX. HalmesA. J. LicariG. SmithJ. W. SongY. MooreE. G. ChenQ. TajkhorshidE. RienstraC. M. MooreJ. S. ACS Macro Lett. 2019813651371 doi.org/10.1021/acsmacrolett.9b00559
- SwanekampR. J. DimaioJ. T. M. BowermanC. J. NilssonB. L. J. Am. Chem. Soc. 201213455565559 doi.org/10.1021/ja301642c
- NagyK. J. GianoM. C. JinA. PochanD. J. SchneiderJ. P. J. Am. Chem. Soc. 20111331497514977 doi.org/10.1021/ja206742m
- Nagy-SmithK. BeltramoP. J. MooreE. TyckoR. FurstE. M. SchneiderJ. P. ACS Cent. Sci. 20173586597 doi.org/10.1021/acscentsci.7b00115
- BrasseurL. CoensA. WaeytensJ. MelkiR. BoussetL. Biochem. Biophys. Res. Commun. 2020526410416 doi.org/10.1016/j.bbrc.2020.03.108
- FloresB. N. DulchavskyM. E. KransA. SawayaM. R. PaulsonL. ToddP. K. BarmadaS. J. IvanovaM. I. PLoS One201611e0165084 doi.org/10.1371/journal.pone.0165084
- YangH. YangS. KongJ. DongA. YuS. Nat. Protoc. 201510382396 doi.org/10.1038/nprot.2015.024
- SotoC. SigurdssonE. M. MorelliL. KumarR. A. CastanoE. M. FrangioneB. Nat. Med. 19984822826 doi.org/10.1038/nm0798-822
- JiangX. HalmesA. J. LicariG. SmithJ. W. SongY. MooreE. G. ChenQ. TajkhorshidE. RienstraC. M. MooreJ. S. ACS Macro Lett. 2019813651371 doi.org/10.1021/acsmacrolett.9b00559
- GaoY. JoshiM. ZhaoZ. MitragotriS. Bioeng. Transl. Med. 20249e10600 doi.org/10.1002/btm2.10600
- JahaniA. NassiraH. Mater. Chem. Horiz. 202431074
- JoralemonM. J. McRaeS. EmrickT. Chem. Commun. 20104613771393 doi.org/10.1039/b920570p
- MoneraO. D. KayC. M. HodgesR. S. Protein Sci. 1994319841991 doi.org/10.1002/pro.5560031110
Republished from the open web under CC-BY. Authors: Gray VP, Cui Z, Klepsig M, Letteri RA. Read the original.