Detection of a Target Nucleic Acid by Ligation-Assisted Fluorescence Enhancement of a Peptide Nucleic Acid (PNA) Twin Probe via Disulfide Binding.
The development of methods for detecting specific nucleic acids is important for early diagnosis and treatment of diseases at the genetic level. We have developed a pair of pyrene (Pyr)-modified peptide nucleic acids (PNAs), PNA twin probe, as a tool for such detection. In this study, we prepared Pyr-PNAs containing chloroacetyl (-COCH 2 Cl) or thiol (-SH) groups at the termini by solid-phase peptide synthesis. By analyzing various candidates, we clarified that a pair of Pyr-PNAs, each containing an SH group, formed a disulfide bond through the hybrid formation of two PNAs with complementary DNA, resulting in excimer emission at 455 nm. Furthermore, we demonstrated that these Pyr-PNAs provide fluorescent detection of intracellular target RNAs through enhanced excimer emission via the ligation. This work should aid future studies aimed at the specific fluorescent detection of RNA in living cells.
Introduction
Peptide nucleic acids (PNAs) are artificial nucleic acid analogues that have excellent potential as probes for detecting nucleic acids (DNA and RNA) with specific sequences. This is because PNAs are resistant to nucleases and proteases and form duplexes with DNA or RNA that are more thermally stable than corresponding DNA/DNA and DNA/RNA hybrids. PNAs also exhibit higher sequence specificity than natural DNA probes. It has been reported that the presence of a single mismatch in the target DNA decreases the melting temperature (Tm) by 4°C–16°C for DNA/DNA duplexes and by 8°C–21°C for PNA/DNA duplexes [1,2]. Based on these properties, PNA‐based electrochemical biosensors [3,4] and fluorescent probes [5] have been developed, and numerous highly accurate and reliable detection methods have been reported.
Among these, PNA‐based electrochemical biosensors have attracted considerable attention as promising probe systems because their charge‐neutral backbone suppresses nonspecific electrostatic interactions, thereby reducing background signals [6,7,8,9,10,11,12,13,14,15,16]. These platforms enable highly sensitive and selective nucleic acid detection through electrochemical readout strategies that exploit signal changes associated with hybridization. In recent years, their performance has been significantly improved through integration with nanostructured materials [6,7,8], signal amplification chemistries [9,10,11,12], polymer imprinting techniques [13], and DNA origami structures [14], leading to ultrahigh sensitivity for the detection of nucleic acids including miRNA and viral DNA. Further applications have been demonstrated in microbial detection [8,9] and in performance enhancement via lateral spatial control of polymer brushes on two‐dimensional interfaces [15]. In addition, progress has been made in in vivo‐to‐in vitro signal conversion technologies for disease monitoring using urine biopsy samples [16]. Overall, these studies suggest that PNA‐based hybrid biosensing platforms are versatile and powerful tools for highly sensitive and selective electrochemical nucleic acid detection.
PNA‐based fluorescent probes have also been extensively developed as versatile scaffolds for nucleic acid sensing, owing to their high binding affinity. These probes have been further extended into functional systems capable of converting biological events into detectable optical signals [17,18,19,20,21,22,23,24,25,26]. In recent years, such platforms have enabled activity‐to‐signal conversion, in which enzymatic activities such as proteases are translated into nucleic acid or fluorescence outputs [17,18]. FIT (forced intercalation technique)‐type and triplex‐forming PNA probes have been developed for the recognition of structured RNAs, including viral RNA and double‐stranded RNA [19,20]. Importantly, recent advances include signal enhancement strategies based on surrogate base design and photonic engineering. These include red‐shifted bisquinoline fluorophores [21], chemically modified FIT‐PNAs for improved cellular imaging performance [22], and high‐brightness systems utilizing FRET and light‐harvesting mechanisms [23]. These approaches have also been applied to diagnostic applications such as drug resistance detection [24]. Furthermore, PNA technology has been extended to nucleic acid structural analysis and microbial identification, including studies on G‐quadruplex structures [25] and rapid bacterial detection using optimized PNA‐FISH (fluorescence in situ hybridization) systems [26].
Motivated by these fluorescent PNA‐based sensing strategies, we focus on nucleic acid detection methods that combine fluorescence readout with the structural advantages of PNA, as such systems are relatively easy to handle and allow direct visual detection. In our previous work [27,28], we demonstrated that two Pyr‐labeled PNAs (PNA twin probe) exhibit a fluorescence response that changes from monomer emission to excimer emission upon hybridization with a target DNA, enabling its detection. We also showed that the distance and relative orientation of Pyr moieties in the DNA‐bound complex significantly affect excimer emission. However, the observed excimer‐to‐monomer emission ratio was approximately 1.2, suggesting that further improvement is still possible.
Although the previous system was promising, the two Pyr moieties are likely to retain a certain degree of conformational flexibility, which may prevent the formation of a fully stabilized excimer state. In this study, we therefore designed a strategy to covalently link the two Pyr‐bearing PNAs upon hybridization on the DNA template. We hypothesized that restricting the relative motion of the two Pyr moieties by covalent linkage would lead to more stable excimer formation and enhanced fluorescence emission. To our knowledge, only one related approach has been reported by Seitz et al., in which fluorescence detection of nucleic acids was achieved via native chemical ligation using a combination of fluorescein and tetramethylrhodamine [29]. In the present study, we investigate suitable reactive groups and optimal inter‐PNA distances for ligation using a PNA twin probe system.
Material and Methods
Materials
9‐Fluorenylmethyloxycarbonyl group (Fmoc)‐protected amino acids, Fmoc‐derivatized super acid‐labile poly(ethylene)glycol (Fmoc‐NH‐SAL‐PEG) resin, Fmoc‐Ala(Pyn)‐OH (a Pyr derivative), Fmoc‐protected alkyl linkers [Fmoc‐NH‐(CH2)6‐COOH], Fmoc‐Arg(Pbf)‐OH, Fmoc‐Cys(Trt)‐OH, Fmoc‐Lys(ivDde)‐OH, piperidine,O‐(1H‐benzotriazol‐1‐yl)‐N,N,N′,N′‐tetramethyluronium hexafluorophosphate (HBTU),N‐methylmorpholine (NMM), trifluoroacetic acid (TFA), ethanedithiol (EDT), and triisopropylsilane (TIPS) were purchased from Watanabe Chemicals (Hiroshima, Japan). Fmoc‐protected PNA monomers [Fmoc‐A(Bhoc)‐OH, Fmoc‐T‐OH, Fmoc‐G(Bhoc)‐OH, and Fmoc‐C(Bhoc)‐OH] were purchased from Panagene (Daejeon, South Korea). Fmoc‐Dpr(ivDde)‐OH was purchased from Novabiochem (Tokyo, Japan). Fmoc‐Dab(ivDde)‐OH, Fmoc‐Orn(ivDde)‐OH, and 2‐(tritylthio)acetic acid were purchased from BLD Pharm (Shanghai, China).N,N′‐Dimethylformamide (DMF),N‐methyl‐2‐pyrrolidinone (NMP), diethyl ether, acetonitrile, hydrazine monohydrate, dichloromethane (DCM), and HEPES were purchased from FUJIFILM Wako Pure Chemical Corporation (Osaka, Japan). Phosphate‐buffered saline (PBS; 100 mM, pH 7.0) and RPMI 1640 were purchased from Nacalai Tesque (Kyoto, Japan). DNA oligomers and 100 U/mL penicillin–streptomycin were purchased from Thermo Fisher Scientific (Waltham, MA, USA). 10% fetal bovine serum (FBS) was purchased from Sigma‐Aldrich (St. Louis, MO, USA). FITC‐Annexin V was purchased from Biolegend (San Diego, CA, USA).N‐(Chloroacetoxy)succinimide (Cl‐CH2‐OSu), prepared as previously reported [30], was used in this study.
Synthesis of Peptides
All Pyr‐PNA probes (A1–A4andB1–B7; Figure2) were prepared on Fmoc‐NH‐SAL‐PEG resin with a loading of 7.2 μmol Fmoc/g on its surface using conventional Fmoc‐based solid‐phase peptide synthesis. Deprotection and coupling processes were carried out at room temperature. No capping step was performed. The deprotection of Fmoc was carried out using 20% piperidine in DMF for 7 min. For each coupling process, 4 equiv. Fmoc‐protected PNA monomers, Fmoc‐protected alkyl linkers, Fmoc‐Cys(Trt)‐OH, Fmoc‐Arg(Pbf)‐OH, Fmoc‐Dpr(ivDde)‐OH, Fmoc‐Dab(ivDde)‐OH, Fmoc‐Orn(ivDde)‐OH, Fmoc‐Lys(ivDde)‐OH, or Fmoc‐Ala(Pyn)‐OH, 3.6 equiv. HBTU, and 11.5 equiv. NMM were dissolved in DMF or a DMF/NMP mixture and added to the resin. The reaction was allowed to proceed for 40 min. Coupling and deprotection steps were continued until the desired peptide was elongated.A1,A4, andB1possessed free N‐terminal amino groups, and the amino termini ofB2–B7were acetylated. The amino termini ofA2andA3were coupled with Cl‐CH2‐OSu and 2‐(tritylthio) acetic acid, respectively. To further deprotect the ivDde group on the side‐chain amino groups ofB2–B7, the group was treated with 5% hydrazine in DMF for 10 min three times, and thenB2was coupled with Cl‐CH2‐OSu,B4with Cys, andB3andB5–B7with 2‐(tritylthio) acetic acid. After the final step, the resin was washed with DCM and then the peptides on the resin were globally deprotected and cleaved from the resin by treatment with 95:2.5:2.5 (v/v) TFA/TIPS/water for 90 min at room temperature. If the peptide contained a thiol group, it was treated with 92.5:2.5:2.5:2.5 (v/v) TFA/EDT/TIPS/water for 90 min at room temperature. Crude peptides were precipitated in diethyl ether and washed with diethyl ether until neutral pH was reached. Peptides were then dried by air and dissolved in 0.1% TFA in water. Peptides were purified using reverse‐phase high‐pressure liquid chromatography (HPLC) on a C18 preparative column (Cadenza 5CD‐C18; Imtakt, Kyoto, Japan) with a linear gradient of eluent A (0.1% TFA in water) and eluent B (acetonitrile). The detection was carried out at 340 nm and the flow rate was 10.0 mL/min. Final product identification was performed using matrix‐assisted laser desorption/ionization‐time‐of‐flight (MALDI‐TOF) mass spectrometry (Shimadzu MALDI‐7090) (FiguresS1,S2) and HPLC on a C18 analytical column (Cadenza CD‐C18; Imtakt) (FiguresS3,S4). We also identified the final compounds from UV–vis spectroscopy (using a JASCO V‐560 UV–vis spectrometer).
![(A) Chemical structures of Pyr‐PNAs (PNA twin probe:A1–A4andB1–B7). (B) Sequences of the Pyr‐PNAs and DNAD1–D13. C6 represents an alkyl linker [‐NH‐(CH2)6‐CO‐]. Dap, Dab, and Orn represent diaminopropanoic acid, diaminobutanoic acid, and ornithine backbone, respectively. PNA sequences are shown in italics. Underlines and dotted underlines in DNA represent complementary sequences to theAseries andBseries, respectively.](https://pub-4f2af807d45642319f8e7f07a4c88770.r2.dev/PMC13178207/BIP-117-e70105-g002.jpg)
(A) Chemical structures of Pyr‐PNAs (PNA twin probe:A1–A4andB1–B7). (B) Sequences of the Pyr‐PNAs and DNAD1–D13. C6 represents an alkyl linker [‐NH‐(CH2)6‐CO‐]. Dap, Dab, and Orn represent diaminopropanoic acid, diaminobutanoic acid, and ornithine backbone, respectively. PNA sequences are shown in italics. Underlines and dotted underlines in DNA represent complementary sequences to theAseries andBseries, respectively.
Fluorescence Spectroscopy
Fluorescence measurements were performed using a JASCO FP‐8200 fluorescence spectrometer and a 1 cm quartz cell. Fluorescence spectra of PNA twin probe (A1–A4andB1–B7) with or without DNA (D1–D13) were measured at 25°C in aqueous buffer (10 mM PBS, pH 7.0). The final concentration of Pyr‐PNAs and DNA were both 1.0 μM. The excitation wavelength was 350 nm, and the emission wavelengths range was from 370 to 580 nm. The fluorescence spectra were normalized with the fluorescence intensity at 380 nm derived from the Pyr monomer set as 1.0. The mixture solutions were measured after incubation for the predetermined time. The Pyr‐PNAs were stored as dry powders and dissolved in distilled water immediately prior to use, followed by dilution into the appropriate buffer solution. The concentrations were determined based on the UV absorbance at 260 nm of the probes. All experiments were performed using buffer solutions prepared under atmospheric conditions, without any additional degassing or special pretreatment prior to measurement.
Fluorescence Microscopy Images
Human lung cancer cell lines, PC9 cells (Japan Bioresource Collection Cell Bank, Osaka, Japan) and A549 cells (ATCC, Manassas, VA, USA), were cultured in RPMI 1640 supplemented with 10% FBS, 100 U/mL penicillin–streptomycin, and 25 mM HEPES. Both cells were maintained in a 5% CO2incubator at 37°C. Cells (0.5 × 10⁴) were seeded on a 24 well plate (Greiner Bio‐One GmbH, Kremsmünster, Austria) 1 day prior to PNA treatment. The next day, PNAs were diluted in culture medium and combined to prepare 10 μM respective PNA pairs. The cell culture medium was removed, and 300 μL of 10 μMA1/B1orA4/B3PNA pair was added to the cells. After 3 h or 24 h incubation, image acquisition and quantitative analysis were performed using CellVoyager CQ1 equipped with the CellPathfinder built‐in analysis software (Yokogawa Electric Corporation, Tokyo, Japan). The PNA twin probe–derived fluorescence images were acquired using a 405 nm excitation laser, and the emission was collected in the 417–477 nm range. Fluorescent intensities were quantified by measuring the signal for each individual cell, and the mean fluorescence intensity per cell was used for subsequent analyses. For the cytotoxic assay, theA4/B3PNA pair stimulated cells were treated with FITC‐Annexin V for 30 min and fluorescence images were acquired using a 488 nm excitation laser, and the emission was collected in the 500–550 nm range.
Results and Discussion
Design
A schematic illustration of this study is shown in Figure1. In the PNA twin probe used in our previous study, the target DNA and two Pyr‐PNAs form a hybrid, and the DNA acts as a template to orient the two Pyr moieties so that they face each other, thereby promoting excimer formation and fluorescence emission. In contrast, the Pyr‐PNAs used in this study are characterized by the introduction of reactive groups adjacent to the Pyr moieties. When the target DNA and the two Pyr‐PNAs form a hybrid, their reactive groups, like the two Pyr units, are also positioned facing each other.
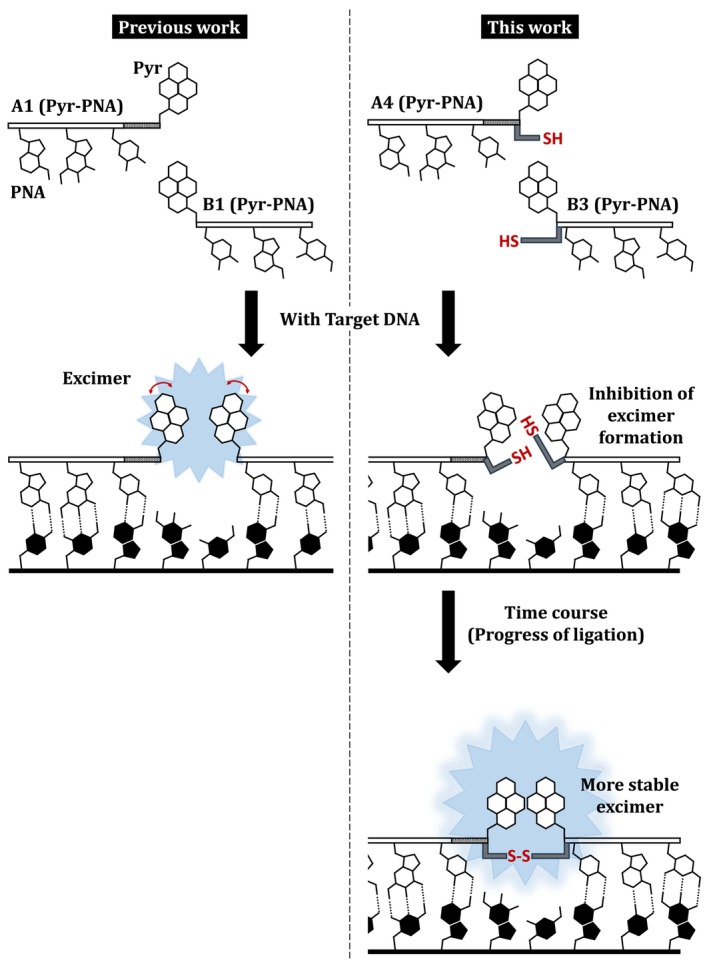
Schematic illustration of PNA twin probe for fluorescence detection of target nucleic acids. The PNA twin probe used in our previous work (left) and the reactive PNA twin probe used in this work (right).
Prior to the reaction, these reactive groups introduce steric hindrance and inhibit excimer formation between the Pyr moieties. However, over time, the two PNA strands become covalently linked via a reaction between the reactive groups. As a result, after the reaction, the aforementioned steric hindrance is removed, and the reactive groups instead contribute to facilitating excimer formation. Thus, the reactive PNA twin probe in this study is expected to exhibit time‐dependent and stronger fluorescence emission compared with the PNA twin probe reported in our previous work.
In pursuit of the above approach, we designed and synthesized a series of 11 Pyr‐PNAs,A1–A4andB1–B7(Figure2).A1–A4consist of a 10‐mer PNA (base sequence: TGATAGCGAC) whose N‐terminus is modified with a pyrenylalanine via a C6 linker [‐NH‐(CH2)6‐CO‐] and whose C‐terminus is conjugated with tetraarginine (R4).B1–B7consist of a 10‐mer PNA (base sequence: TCGGAGATGT) whose C‐terminus is modified with a pyrenylalanine and whose N‐terminus is conjugated with R4.
The R4is expected to play a role as a cell‐penetrating peptide (CPP) [31,32], as well as to improve the water solubility of the PNA probe. Although the R4seems short compared with typical oligoarginine‐based CPPs, we previously reported that even triarginine and tetraarginine can be introduced into cells [33,34].A1andB1have the same structures as those used in our previous study [27].
In addition to theA1structure, the N‐termini ofA2–A4were further modified with a chloroacetyl group (ClCH2CO‐), a thioacetyl group (HSCH2CO‐), and a cysteine [HSCH2CH‐(‐NH2)‐CO‐], respectively. Moreover, theB1backbone, the C‐termini ofB2–B7were further modified with a chloroacetyl derivative [‐NH‐CH(‐CH2NHCOCH2Cl)‐CO‐;B2], a thioacetyl derivative [‐NH‐CH(‐CH2NHCOCH2SH)‐CO‐;B3], a cysteine derivative {‐NH‐CH[‐CH2NHCOCH(CH2SH)‐NH2]‐CO‐;B4}, and versions ofB3with different alkyl chain lengths {‐NH‐CH[−(CH2)nNHCOCH2SH]‐CO‐};B5(n= 2),B6(n= 3), andB7(n= 4).
The thioacetyl group was employed based on its structural similarity to the chloroacetyl group. In contrast, cysteine was used because it exhibits higher nucleophilicity than the thioacetyl group under neutral pH conditions and is expected to promote disulfide bond formation [35]. In this study, these two types of thiol‐containing components were used to investigate the effects of nucleophilicity and steric structure of the thiol moieties on disulfide bond formation in the present system, and the results are described in Section3.3.B5,B6, andB7were synthesized to investigate how the distance between the Pyr moiety and the reactive group (thioacetyl group) on the B‐probe side affects excimer formation associated with disulfide bond formation.
The base sequences of theAseries andBseries are antiparallel and complementary to the 5′ and 3′ ends of DNAD1–D10(underlines and dotted underlines in Figure2B), respectively.D1–D10are sequences with various numbers of adenines inserted between the sequences complementary to theAseries andBseries. Among these,D3mimics the RNA sequence of the EGFR mutation exon 19 deletion E746–A750.D11mimics the RNA sequence of exon 19.D12is a scrambled sequence ofD3. InD13, the 10th A residue inD3is replaced with C; thus,D13contains a single mismatch at the position closest to the Pyr moiety in theAseries.
TheAandBseries were designed such that, upon hybridization with DNA, their Pyr moieties face each other. Furthermore, the ClCH2‐ and HS‐ groups inA2–A4andB2–B7are also positioned to face each other, enabling covalent bond formation.
Time‐Dependent Ligation and Excimer Formation of Pyr‐PNA Twin Probe
We first compared fluorescence spectra of PNA twin probeA1/B1used in our previous study with those of PNA twin probeA4/B3that is likely to induce ligation (Figures3andS5). We measured fluorescence spectra after 20 min of mixingA1andB1with and without DNA (FigureS5A). InA1/B1alone, emission from the Pyr monomer was observed at 380 and 400 nm. The same profile was also observed forA1/B1with non‐complementaryD12. Meanwhile, inA1/B1with complementaryD3, strong emission from the Pyr excimer was observed at 480 nm in addition to the monomer emission. These results indicate thatA1andB1detect a target nucleic acid in a sequence‐specific manner, which is consistent with our previous report on PNA twin probe [27].
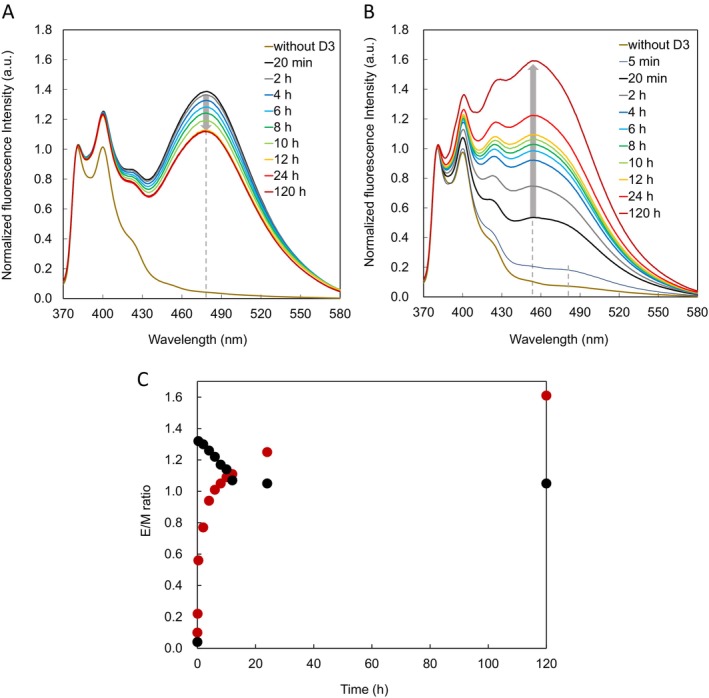
Fluorescence spectra of equimolar mixtures ofA1/B1/D3(A) andA4/B3/D3(B) in aqueous buffer at various time points after mixing. (C) Time course of fluorescence intensity of equimolar mixtures ofA1/B1/D3(E480/M380; black circles) andA4/B3/D3(E455/M380; red circles) based on data shown in (A) and (B).
Next, we measured fluorescence spectra after 20 min of mixingA4andB3with and without DNA (FigureS5B). In the fluorescence spectra ofA4/B3with and withoutD12, only monomer‐derived emission was observed. InA4/B3withD3, the emission from the Pyr excimer was observed around 455 nm in addition to the monomer emission, but the excimer emission appeared to be weaker than that observed inA1/B1withD3.
We then measured the fluorescence spectra of the mixtures shown in Figure3Aafter 24 h (FigureS5C). All fluorescence spectra showed almost the same profile as those shown in FigureS5A. These are reasonable results, indicating that the fluorescence emission of the mixture remains essentially unchanged over time.
We further measured the fluorescence spectra of the mixtures shown in FigureS5Bafter 24 h (FigureS5D). The fluorescence spectra ofA4/B3with and withoutD12also showed almost the same profiles as those shown in FigureS5B, which is a reasonable result. In contrast, whenD3was used, a clear enhancement of excimer fluorescence at 455 nm was observed.
Following these results, we measured the fluorescence spectra ofA1/B1andA4/B3after incubation withD3for various times (Figure3A,B, respectively). InA1/B1/D3, the fluorescence spectra did not change significantly from 20 min to 120 h, and the excimer fluorescence intensity at 480 nm was observed to be comparable to that of the monomer fluorescence. In contrast, inA4/B3/D3, weak and broad fluorescence signals were observed at 480 and 455 nm after 5 min. An increase in the excimer fluorescence at 455 nm was observed after 20 min, although it remained lower than the monomer emission. The fluorescence intensity further increased over time, and the highest intensity within the observed measurement period was recorded at 120 h. It should be noted that this value does not necessarily represent a plateau or the endpoint of the reaction, as measurements beyond 120 h were not performed.
We plotted the ratio of the fluorescence intensities of the excimer and monomer (E480/M380, the ratio of 480–380 nm forA1/B1/D3; and E455/M380, the ratio of 455–380 nm forA4/B3/D3) against time (Figure3C). Assuming that E480/M380(= 0.04) ofA1/B1after 20 min withoutD3is the E480/M380ofA1/B1/D3after 0 min, E480/M380rapidly increased after 20 min, reaching a maximum of 1.32. This indicates that hybridization between Pyr‐PNAs and DNA was completed instantaneously. After that, for unknown reasons, the E480/M380gradually decreased, and the E480/M380ratio was 1.07 after 12 h, after which it remained almost constant. Although the cause of the gradual decrease in excimer fluorescence is unclear, it cannot be ruled out that aggregation of PNA components or photobleaching of the Pyr moieties may have occurred during the experiment.
In contrast, E455/M380ofA4/B3/D3gradually increased after mixing, reaching 0.56 after 20 min and 1.11 after 12 h, exceeding that ofA1/B1/D3. E455/M380continued to increase slowly, reaching 1.25 after 24 h and 1.61 after 120 h. We further measured equimolar mixtures ofA4/B3andA4/B3/D3(final concentration of each was 20 μM) by RP‐HPLC after 24 h (FigureS6). InA4/B3, the peaks ofA4andB3were observed at 9.50 and 9.25 min, respectively, while inA4/B3/D3, a new broad peak at 10.98 min was confirmed in addition to these peaks. Fractions of the new peak were collected, and MALDI‐TOF mass spectrometry was performed (FigureS7), indicating thatA4andB3were linked via a disulfide bond (observed: 7750.19 Da, calculated: 7752.33 Da).
In Figure3, the excimer fluorescence ofA4/B3/D3(455 nm) is blue‐shifted by 25 nm compared with that ofA1/B1/D3(480 nm). We initially considered that this shift might reflect a transition from a dynamic to a static excimer, as reported for pyrene systems [36,37,38,39,40]. However, analysis of the excitation and UV–vis spectra (FigureS8) indicates that both emissions originate from dynamic excimers. Therefore, the observed blue shift is more likely attributable to differences in the relative orientation and distance between the two Pyr moieties. In particular, covalent linkage via disulfide bond formation is expected to restrict conformational flexibility and impose a more defined geometry on the Pyr pair. Such structural constraints can alter the excimer emission energy, resulting in a blue shift.
These results indicate that the PNA twin probeA4/B3can detect target DNA by fluorescence from stable excimers formed over time. This fluorescence occurs through ligation caused by reactive groups contained in the two Pyr‐PNAs after hybridization to DNA. Furthermore, the fluorescence intensity was found to be higher than that of the unlinked PNA twin probe reported previously.
Effect of Terminal Reactive Groups on Ligation and Excimer Formation
Based on the concept shown in Figure1, if one of the two Pyr‐PNAs does not have a reactive group, the ligation will not proceed. Meanwhile, the ligation may also proceed with other pairs of reactive groups, and excimer fluorescence may be obtained via a process similar to that ofA4/B3. Therefore, we measured the fluorescence spectra of the mixtures containingD3with combinations ofA1–A4andB1–B4after 120 h (FigureS9). The E480/M380and E455/M380values obtained from these fluorescence spectra are summarized in Figure4.
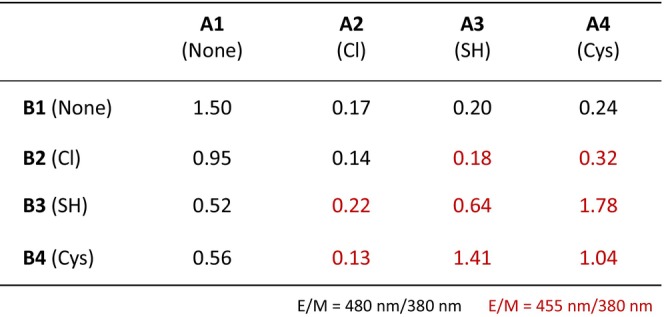
E/M values obtained from the fluorescence spectra shown in FigureS9. Black and red numbers indicate E480/M380and E455/M380, respectively.
Again,A1/B1(none/none) showed an E480/M380value of 1.50 (FigureS9A).A1/B2(none/chloroacetyl),A1/B3(none/thioacetyl), andA1/B4(none/Cys) exhibited lower E480/M380values (0.95, 0.52, and 0.56, respectively), indicating that excimer formation via ligation does not occur in the absence of a reactive group and that such modifications may sterically interfere with excimer formation between the two Pyr‐PNAs on the DNA template.
Similar trends were observed forA2/B1(chloroacetyl/none),A3/B1(thioacetyl/none), andA4/B1(Cys/none), as shown in FigureS9B, with E480/M380values of 0.17, 0.20, and 0.24, respectively. The stronger decrease observed in theB‐series modifications compared with theA‐series remains unclear, but in any case, the reactive‐group modifications that do not support ligation negatively affect excimer formation.
A2/B2(chloroacetyl/chloroacetyl) is also not expected to support ligation, and as expected, showed a smaller E480/M380value (0.14), as shown in FigureS9C. Meanwhile, in the case ofA2/B3(chloroacetyl/thioacetyl),A2/B4(chloroacetyl/Cys),A3/B2(thioacetyl/chloroacetyl), andA4/B2(Cys/chloroacetyl), we expected that, when two Pyr‐PNAs formed a hybrid onD3, the chloroacetyl group would react with the thiol group to form a thioether bond. However, unfortunately, E455/M380showed small values of 0.22, 0.13, 0.18, and 0.32, respectively. These results suggest that the reaction of the thiol group with the chloroacetyl group hardly proceeds under these experimental conditions. These findings are also consistent with the results in FigureS9A,Bthat the reactive groups sterically inhibit excimer formation. However, we note that slight excimer fluorescence was observed at 455 nm forA4/B2. We speculate that this emission represents excimer fluorescence via the formation of a thioether bond.
Next, disulfide bond formation was expected inA3/B3,A3/B4,A4/B3, andA4/B4, which are modified with thiol groups (FigureS9D). Among these combinations,A4/B3(Cys/thioacetyl) showed the highest E455/M380value (1.78), followed byA3/B4(thioacetyl/Cys, 1.41). In addition,A3/B3(thioacetyl/thioacetyl) andA4/B4(Cys/Cys) showed lower values of 0.64 and 1.04, respectively. Although Cys was expected to promote disulfide bond formation and excimer emission more efficiently than the thioacetyl group due to its higher nucleophilicity, the observed trends suggest that both the combination of reactive groups and their steric and structural factors collectively influence disulfide bond formation and excimer emission [35].
Effect of Reactive Group Distance on Ligation and Excimer Formation
Next, to assess whether the distance of the reactive groups in the Pyr‐PNAs on the DNA template affects the formation of excimer through ligation, we measured the fluorescence spectra of equimolar mixtures ofA4/B3with different linker lengths between the PNA and the reactive group in aqueous solutions containingD3after 20 min and 24 h, and compared their E455/M380(Figures5AandS10).
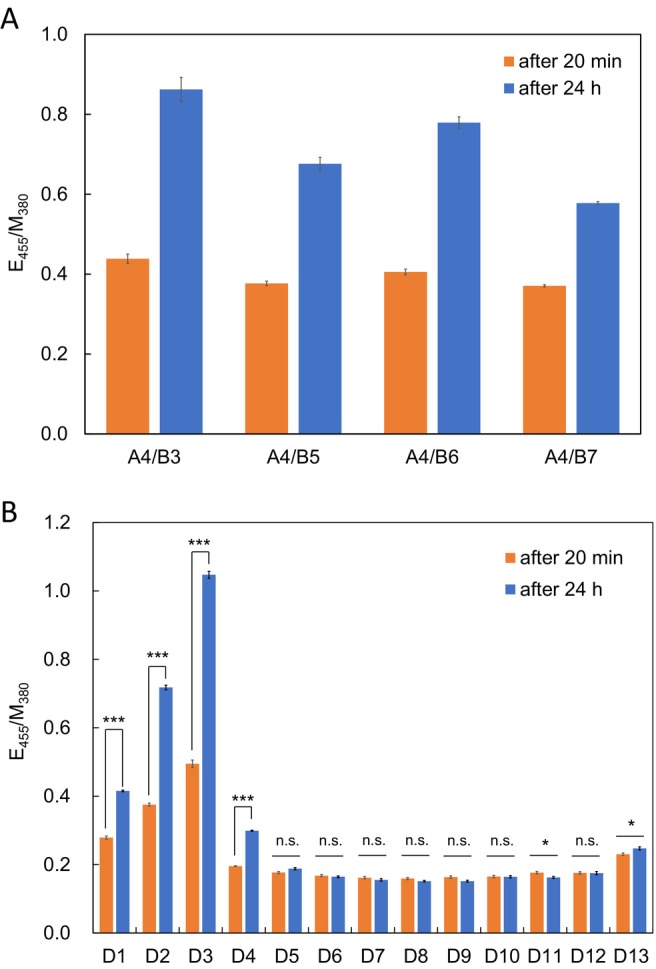
*E455/M380obtained from fluorescence spectra after 20 min and 24 h for equimolar mixtures of (A)A4andB3orB5–B7withD3and (B)A4andB3withD1–D13. Fluorescence intensity of complex‐derived signals was quantified from fluorescence spectra (mean ± SD,n= 4, *p< 0.05, **p< 0.001). Statistical significance was evaluated using one‐way ANOVA followed by Tukey's multiple comparisons test.
AllA4/B3andA4/B5–B7showed higher E455/M380after 24 h than after 20 min, indicating that ligation proceeds and excimer fluorescence increases. Meanwhile, it was also revealed that the difference in linker length affects E455/M380after 24 h. E455/M380reached a maximum of 0.86 forA4/B3bearing Dap(‐COCH2SH) and a minimum of 0.58 forA4/B7with Lys(‐COCH2SH). That is, within this measurement range, longer alkyl linkers tended to show smaller E455/M380. This result indicates that the difference in alkyl linker chain length affects the promotion of the reaction between reactive groups, which is reflected in the excimer fluorescence through ligation. In other words, this result indicates that there is an appropriate distance between reactive groups for ligation to occur.
Next, we assessed E455/M380after 20 min and 24 h forA4/B3, containing DNAD1–D11with different numbers of inserted adenine residues (Figures5BandS11). ForD1,D2, andD3, E455/M380increased with time, and the values increased as the number of inserted adenine residues increased (0.42, 0.72, and 1.05 after 24 h, respectively). However, E455/M380forD4decreased significantly (0.30 after 24 h), and E455/M380forD5and later remained decreased and showed almost no change at 20 min (0.16–0.18) and 24 h (0.15–0.19). In other words, E455/M380decreased as the number of inserted adenine residues increased. This result was not limited to the inserted base being adenine, but was the same forD11(0.18 after 20 min, 0.16 after 24 h). These results clearly indicate that the linkage of the reactive groups between the Pyr‐PNAs on DNA is affected by these distances, and furthermore, that there is an optimal distance. Among the DNAs used in this study,D3provides the optimal distance for the linkage. We speculate that, inD2andD1, the Pyr‐PNAs are too close to each other and, as a result, the reactive groups are separated from each other. We also speculate that when Pyr‐PNAs are separated by four or more bases along the DNA, the reactive groups cannot interact, and linkage does not occur.
Again,A4/B3with the scrambled sequenceD12showed no excimer fluorescence response regardless of time (E455/M380was 0.18 after 20 min and 24 h). Under these conditions,A4andB3are not expected to form a hybrid withD12in the first place, indicating that the binding ofA4andB3is essential for their assembly on the DNA template.
D13corresponds to theD3sequence containing one mismatch at the position closest to the Pyr ofA4. BothA4andB3are expected to form hybrids withD13, but E455/M380was almost unchanged after 20 min (0.23) and 24 h (0.25), implying that a fluctuation of reactive groups caused by the mismatch at the terminus of Pyr‐PNA significantly inhibits ligation.
These results indicate that, in PNA twin probes, adjusting the distance between the reactive groups of Pyr‐PNAs on DNA is important for the reaction between the reactive groups and subsequent stable excimer formation and fluorescence emission via ligation.
Intracellular Fluorescence Detection of Target RNA Using Reactive Pyr‐PNA Twin Probe
Finally, to examine whetherA4/B3detects target RNA in living cells, lung adenocarcinoma cell lines PC9 and A549 were incubated with the probe and observed by fluorescence microscopy (Figure6).A4andB3contain a sequence complementary to the sequence caused by a deletion mutation in exon 19 of EGFR (E19D) expressed in PC9 cells (5′‐GUCGCUAUCAAAACAUCUCCGA‐3′; the solid and dashed underlines are the sequences complementary toA4andB3, respectively; the RNA sequence corresponds toD3). Meanwhile,A4/B3also contains a sequence complementary to the sequence of exon 19 of normal EGFR (E19) expressed in A549 cells (5′‐GUCGCUAUCAAGGAAUUAAGAGAAGCAACAUCUCCGA‐3′; the RNA sequence corresponds toD11). However, as shown by in vitro experiments, excimer fluorescence is expected to occur at E19D but not at E19 due to differences in base insertion between the hybrids formed with RNA byA4andB3.
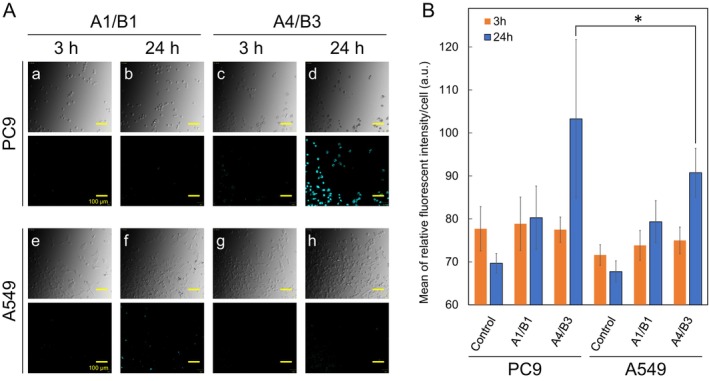
*(A) Fluorescence images from live‐cell imaging of PC9 or A549 cells incubated with the PNA twin probe. The upper panels show bright‐field images and the lower panels show fluorescence images. The PNA twin probe was used at an incubation concentration of 10 μM, and images were acquired at 3 and 24 h after probe addition. The scale bar represents 100 μm. (B) Quantification of complex‐derived fluorescence intensity obtained from the fluorescence images (mean ± sd,n= 4, p< 0.05). Fluorescence intensity was quantified at the single‐cell level, and the mean value within each well was calculated and treated as one independent sample (n= 1). Four independent wells were analyzed per condition. Statistical significance was determined using one‐way ANOVA followed by Tukey's multiple comparisons test. In the figure, “Control” indicates cells without the PNA twin probe (negative control).
Figures6AandS12show bright‐field images (top panels) and fluorescence images (bottom panels) of PC9 and A549 cells treated for 3 or 24 h with either the non‐reactiveA1/B1or the reactiveA4/B3at the concentration of 1 and 10 μM. In PC9 cells treated withA1/B1and 1 μM ofA4/B3, no intracellular emission indicative of pyrene excimer fluorescence was observed under either condition after 3 h (panel a) or 24 h (panel b). In contrast, in PC9 cells treated with 10 μM ofA4/B3, excimer fluorescence was not detected after 3 h (panel c), whereas clear intracellular excimer fluorescence was observed after 24 h (panel d). Similarly, in A549 cells, no excimer emission was observed under either condition withA1/B1orA4/B3(panels e–h). To validate that the observed fluorescent signals were emitted by the excimer formed probes, PC9 cells were treated with either theA4alone or theB3alone under the same experimental conditions used for theA4/B3combination. In these control experiments, strong fluorescence signals were not observed (FigureS13). These results strongly indicate that the observed fluorescence signals were derived from pyrene excimer emission rather than from monomer emission or nonspecific probe effects. Figure6Bshows the intracellular fluorescence intensity calculated from these fluorescence images. ForA1/B1, fluorescence was barely detectable in either PC9 or A549 cells. In contrast,A4/B3exhibited significantly higher excimer fluorescence in PC9 cells after 24 h compared with A549 cells. The high background fluorescence may be attributed to nonspecific cooperative effects, such as local probe accumulation and homodimerization of the PNA probes.
Finally, cytotoxic effects of theA4/B3were validated using a FITC–Annexin V assay system after treatment at 10 μM for 24 h. As shown in FigureS14, Annexin V–positive staining was observed, particularly in PC9 cells, whereas A549 cells exhibited comparatively weaker cytotoxic responses. These results suggest that the observed cytotoxicity is cell line–dependent rather than nonspecific. The PC9 cells are known to be strongly dependent on EGFR signaling for survival compared to A549 cells. Thus, it is plausible that theA4/B3exerts cytotoxic effects in PC9 cells, at least in part, through partial interference with EGFR signaling; however, the precise underlying mechanism remains to be elucidated in future.
These results suggest that, under the conditions of this study, in PC9 cells containing the target RNA sequence, excimer fluorescence expected fromA1/B1is not sufficiently observed, whereasA4/B3, consistent with in vitro results, gradually produces excimer fluorescence exceeding that ofA1/B1, enabling the fluorescent detection of the target RNA within the cells.
Conclusions
In this study, we successfully detected target nucleic acids via excimer fluorescence using a pair of thiol‐containing Pyr‐PNAs. The observed excimer fluorescence arises from the proximity of thiol groups induced by hybridization of the Pyr‐PNAs on a DNA template, followed by ligation via disulfide bond formation. In the unreacted state, excimer formation is sterically hindered by the presence of free thiol moieties. However, as ligation proceeds and thiols are converted into disulfide bonds, this steric restriction is released, and the relative orientation of the Pyr moieties becomes more fixed, thereby promoting stable excimer formation and enhanced fluorescence emission.
Compared with the conventional PNA twin probe (A1/B1), the reactive PNA twin probe (A4/B3) exhibited time‐dependent and ligation‐dependent excimer formation, resulting in significantly enhanced fluorescence intensity. These results indicate that covalent linkage plays a crucial role in stabilizing the excimer state and improving signal output. Furthermore, ligation efficiency, as well as the resulting excimer formation and fluorescence emission, was found to depend on the inter‐site distance of the PNA twin probe on the DNA template, suggesting that precise spatial arrangement is critical for optimal performance. Notably, the present PNA twin probe also enabled fluorescence‐based detection of target RNA in living cells, demonstrating its potential applicability in biological environments.
To place these findings in context, conventional PNA fluorescent probes typically employ a single PNA strand and detect nucleic acids mainly through fluorescence on/off switching. Similarly, molecular beacons utilize a single PNA strand, where target recognition is based on either a fluorescence turn‐on response or acceptor emission resulting from FRET disruption. In contrast, the PNA twin probe developed in this study employs two PNA strands, thereby increasing the number of recognition bases and enabling higher sequence specificity. In addition, although optimization of fluorophore distance and orientation is required, this system enables excimer formation and FRET‐related processes, allowing ratiometric detection based on longer‐wavelength fluorescence signals. A further distinctive feature of the reactive PNA probe is that the two PNA strands are covalently linked after hybridization. This structural fixation is expected to further stabilize the emissive state and enhance fluorescence output.
Finally, we consider that further investigation is required regarding the emission behavior of the PNA twin probe after dissociation from the RNA/PNA hybrid. If the disulfide‐linked PNA twin probe retains its emissive state after dissociation, it may enable sequential generation of fluorescent probes from a single RNA target, potentially leading to signal amplification. Moreover, although not fully explored in this study, the development of reactive PNA twin probes based on thioether bond formation remains an important future direction. Given the reducing intracellular environment, thioether bonds are expected to exhibit higher stability than disulfide bonds, which may further enhance signal stability and amplification after reaction.
Author Contributions
Yutaka Ouchi:data curation, investigation, visualization.Koki Ishii:methodology, investigation, visualization.Yumiko Sato:data curation, visualization.Yoshitane Imai:funding acquisition.Hideo Matsui:software, writing – review and editing.Takashi Ohtsuki:funding acquisition.Yoshiyuki Hakata:investigation, resources.Hajime Shigeto:data curation, formal analysis, investigation, validation, writing – review and editing.Shohei Yamamura:funding acquisition, resources.Mizuki Kitamatsu:conceptualization, funding acquisition, methodology, project administration, supervision, visualization, writing – original draft.
Funding
This work was supported by Kindai University (IP009).
Conflicts of Interest
The authors declare no conflicts of interest.
Acknowledgments
This work was supported by the 2023 Kindai University Research Enhancement Grant (IP009).
Data Availability Statement
The data supporting the findings of this study are available from the corresponding author upon reasonable request.
Associated Data
Data Availability Statement
The data supporting the findings of this study are available from the corresponding author upon reasonable request.
References
- Carson L. E. and Watson E. E., “Peptide Nucleic Acids: From Origami to Editing,” ChemPlusChem 89, no. 11 (2024): e202400305, 10.1002/cplu.202400305. doi.org/10.1002/cplu.202400305
- Egholm M., Buchardt O., Christensen L., et al., “PNA Hybridizes to Complementary Oligonucleotides Obeying the Watson‐Crick Hydrogenbonding Rules,” Nature 365, no. 6446 (1993): 566–568, 10.1038/365566a0. doi.org/10.1038/365566a0
- Lai Q., Chen W., Zhang Y., and Liu Z., “Application Strategies of Peptide Nucleic Acids Toward Electrochemical Nucleic Acid Sensors,” Analyst 146, no. 19 (2021): 5822–5835, 10.1039/d1an00765c. doi.org/10.1039/d1an00765c
- Meindl B., Pfennigbauer K., Lenz A., Müllauer S., and Holzer B., “Advances in Peptide Nucleic Acid‐Based Sensors and Antisense Therapeutics: Surface Immobilization on Planar Gold Substrates,” Biosensors and Bioelectronics 301 (2026): 118481, 10.1016/j.bios.2026.118481. doi.org/10.1016/j.bios.2026.118481
- Vilaivan T., “Fluorogenic PNA Probes,” Beilstein Journal of Organic Chemistry 14 (2018): 253–281, 10.3762/bjoc.14.17. doi.org/10.3762/bjoc.14.17
- Wu Y., Li Y., Mao J., Zhang W., Ran Q., and Ben Y., “A Novel Electrochemical Biosensor: Sensitive and Quantitative Detection of Circulating Tumor DNA,” Journal of Wuhan University of Technology Materials Science Edition 40, no. 5 (2025): 1514–1523, 10.1007/s11595-025-3187-1. doi.org/10.1007/s11595-025-3187-1
- Kim Y. and Mohanty S. K., “PNA Functionalized Gold Nanoparticles on TiO2Nanotubes Biosensor for Electrochemical DNA Fragment Detection,” Advanced Materials Interfaces 12 (2025): 2400762, 10.1002/admi.202400762. doi.org/10.1002/admi.202400762
- Hendra H., Leesutthiphonchai W., Kuncharoen N., et al., “Electrochemical DNA Biosensor Based on a Novel Pyrrolidinyl Peptide Nucleic Acid Sequence Immobilized on a Graphene Oxide/Bovine Serum Albumin–Modified Electrode for the Direct Diagnosis of Seed‐Borne Pathogen,” Microchimica Acta 192 (2025): 541–555, 10.1007/s00604-025-07371-y. doi.org/10.1007/s00604-025-07371-y
- Zhang S., Zhai X., Yang J., et al., “Peptide Nucleic Acid‐Mediated Electrochemical‐Photothermal Dual‐Mode Biosensor for Ultrasensitive Detection of Sulfate‐Reducing Bacteria,” Microchemical Journal 223 (2026): 117422, 10.1016/j.microc.2026.117422. doi.org/10.1016/j.microc.2026.117422
- Chen X., Chen Y., Tang W., et al., “Enzyme‐Linked Lectin Assay for Amplified Electrochemical Detection of HPV DNA,” Biosensors and Bioelectronics 294 (2026): 118239, 10.1016/j.bios.2025.118239. doi.org/10.1016/j.bios.2025.118239
- Chittuam K., Lersanansit N., Tangkijvanich P., et al., “Electrochemical Sensor for Direct HIV‐1 DNA Detection Using Ruthenium Assembled on a Pyrrolidinyl Peptide Nucleic Acid‐DNA Hybrid,” Bioelectrochemistry 169 (2026): 109172, 10.1016/j.bioelechem.2025.109172. doi.org/10.1016/j.bioelechem.2025.109172
- Zhao Y., Cheng L., Xu M., and Zhao C., “Ultra‐Sensitive Detection of microRNAs Using an Electrochemical Biosensor Based on a PNA‐DNA2 Three‐Way Junction Nanostructure and Dual Cascade Isothermal Amplification,” Analytica Chimica Acta 1345 (2025): 343755, 10.1016/j.aca.2025.343755. doi.org/10.1016/j.aca.2025.343755
- Abdel‐Hamied M., Guo M., Wei Y., et al., “A Novel Hybrid Biosensor for miRNA Detection Based on Peptide Nucleic Acids and Molecularly Imprinted Polymers,” Bioelectrochemistry 165 (2025): 108964, 10.1016/j.bioelechem.2025.108964. doi.org/10.1016/j.bioelechem.2025.108964
- Qin W., Gong X., Duan X., et al., “Supercharged DNA Origami Enhanced Signal Amplification for Ultrasensitive Detection of Nucleic Acid,” Biosensors and Bioelectronics 287 (2025): 117692, 10.1016/j.bios.2025.117692. doi.org/10.1016/j.bios.2025.117692
- Lavecchia di Tocco F., Lopez Carrasco I., Beshchasna N., Cannistraro S., Opitz J., and Bizzarri A. R., “Optimisation of Peptide Nucleic Acid (PNA) Probe Immobilisation by EIS for Enhanced bioFET Detection of miR‐155,” Microchemical Journal 217 (2025): 115074, 10.1016/j.microc.2025.115074. doi.org/10.1016/j.microc.2025.115074
- Wang G., Lu P., Chen M., et al., “Metabolically Stable Chimeric Nucleic Acid Nanoprobe Artificial Biomarker for Cancer Urine Biopsy,” Nano Letters 25 (2025): 8796–8803, 10.1021/acs.nanolett.5c02043. doi.org/10.1021/acs.nanolett.5c02043
- Di Z., Yi X., and Li L., “Protease‐Triggered, Spatially Controlled DNA Assembly in Apoptotic Cells for Early Evaluation of Therapeutic Efficacy,” Journal of the American Chemical Society 145 (2023): 7931–7940, 10.1021/jacs.2c13214. doi.org/10.1021/jacs.2c13214
- Capelli L., Pedrini F., Di Pede A. C., et al., “Synthetic Protein‐To‐DNA Input Exchange for Protease Activity Detection Using CRISPR‐Cas12a,” Analytical Chemistry 96 (2024): 18645–18654, 10.1021/acs.analchem.4c02622. doi.org/10.1021/acs.analchem.4c02622
- Okeke C. U., Miura H., Sato Y., and Nishizawa S., “Kinetic Analysis of Highly Effective Triplex Formation Between a Small Molecule–Peptide Nucleic Acid Conjugate Probe and the Influenza A Virus RNA Promoter Region at Neutral pH,” Organic & Biomolecular Chemistry 21 (2023): 3402–3410, 10.1039/D3OB00262D. doi.org/10.1039/D3OB00262D
- Sato Y., Sato T., Lee E. T. T., et al., “Design of Triplex‐Forming Peptide Nucleic Acid‐Based Fluorescent Probes for Forced Intercalation Sensing of Double‐Stranded RNA Structures,” Analytical Sciences 41 (2025): 531–539, 10.1007/s44211-024-00713-5. doi.org/10.1007/s44211-024-00713-5
- Nazzal H., Gupta M. K., Fadila A., and Yavin E., “A Facile Synthesis of Red‐Shifted Bis‐Quinoline (BisQ) Surrogate Base,” Molecules 29, no. 17 (2024): 4136, 10.3390/molecules29174136. doi.org/10.3390/molecules29174136
- Maree S., Chanda P., Mannully S. T., Zheng H., Appella D. H., and Yavin E., “7‐Methylguanine With a Cyclopentane Backbone: A Bright Combination for a FIT‐PNA RNA Sensor,” British Journal of Biomedical Science 82 (2025): 15526, 10.3389/bjbs.2025.15526. doi.org/10.3389/bjbs.2025.15526
- Homer A., Knoll A., Gruber U., and Seitz O., “Light Harvesting FIT DNA Hybridization Probes for Brightness‐Enhanced RNA Detection,” Chemical Science 16 (2025): 846–853, 10.1039/D4SC06729K. doi.org/10.1039/D4SC06729K
- Tepper O., Appella D. H., Zheng H., Dzikowski R., and Yavin E., “A Biotinylated cpFIT‐PNA Platform for the Facile Detection of Drug Resistance to Artemisinin in Plasmodium Falciparum,” ACS Sensors 9 (2024): 1458–1464, 10.1021/acssensors.3c02553. doi.org/10.1021/acssensors.3c02553
- Zhan X., Deng L., Lian Y., et al., “Enhanced Recognition of a Herbal Compound Epiberberine by a DNA Quadruplex‐Duplex Structure,” Analytical Chemistry 96 (2024): 13174–13184, 10.1021/acs.analchem.4c02054. doi.org/10.1021/acs.analchem.4c02054
- Kim S., Hyun H., Im J.‐K., et al., “Fast and Accurate Multi‐Bacterial Identification Using Cleavable and FRET‐Based Peptide Nucleic Acid Probes,” Biosensors and Bioelectronics 271 (2025): 116950, 10.1016/j.bios.2024.116950. doi.org/10.1016/j.bios.2024.116950
- Ishii K., Tsuchitani S., Toyama M., et al., “Fluorescence Ratiometric DNA Detection by Peptide Nucleic Acid‐Pyrene Binary Probes,” Bioorganic and Medicinal Chemistry Letters 71 (2022): 128838, 10.1016/j.bmcl.2022.128838. doi.org/10.1016/j.bmcl.2022.128838
- Ishii K., Shigeto H., Yamamura S., Imai Y., Ohtsuki T., and Kitamatsu M., “Fluorescence Detection of DNA With a Single‐Base Mismatch by aTm‐Independent Peptide Nucleic Acid (PNA) Twin Probe,” Organic and Biomolecular Chemistry 23, no. 27 (2025): 6557–6563, 10.1039/d5ob00873e. doi.org/10.1039/d5ob00873e
- Dose C. and Seitz O., “Single Nucleotide Specific Detection of DNA by Native Chemical Ligation of Fluorescence Labeled PNA‐Probes,” Bioorganic and Medicinal Chemistry 16, no. 1 (2008): 65–77, 10.1016/j.bmc.2007.04.059. doi.org/10.1016/j.bmc.2007.04.059
- Kitamatsu M., Inoue K., Yamagata N., and Michiue H., “Reaction of Chloroacetyl‐Modified Peptides With Mercaptoundecahydrododecaborate (BSH) is Accelerated by Basic Amino Acid Residues in the Peptide,” PRO 10, no. 11 (2022): 2200, 10.3390/pr10112200. doi.org/10.3390/pr10112200
- Futaki S., “Membrane‐Permeable Arginine‐Rich Peptides and the Translocation Mechanisms,” Advanced Drug Delivery Reviews 57, no. 4 (2005): 547–558, 10.1016/j.addr.2004.10.009. doi.org/10.1016/j.addr.2004.10.009
- Behzadipour Y. and Hemmati S., “Covalent Conjugation and Non‐Covalent Complexation Strategies for Intracellular Delivery of Proteins Using Cell‐Penetrating Peptides,” Biomedicine and Pharmacotherapy 176 (2024): 116910, 10.1016/j.biopha.2024.116910. doi.org/10.1016/j.biopha.2024.116910
- Iguchi Y., Michiue M., Kitamatsu M., et al., “Tumor‐Specific Delivery of BSH‐3R for Boron Neutron Capture Therapy and Positron Emission Tomography Imaging in a Mouse Brain Tumor Model,” Biomaterials 56 (2015): 10–17, 10.1016/j.biomaterials.2015.03.061. doi.org/10.1016/j.biomaterials.2015.03.061
- Ishii K., Hattori Y., Shigeto H., Yamamura S., and Kitamatsu M., “A Fluorescent Complex With PNAs Modified by Boronic Acid and Its Ligand Detects Target RNA in Cells,” Chemistry Letters 53 (2024): upae169, 10.1093/chemle/upae169. doi.org/10.1093/chemle/upae169
- Bermejo‐Velasco D., Azémar A., Oommen O. P., Hilborn J., and Varghese O. P., “Modulating Thiol pKaPromotes Disulfide Formation at Physiological pH: An Elegant Strategy to Design Disulfide Cross‐Linked Hyaluronic Acid Hydrogels,” Biomacromolecules 20, no. 3 (2019): 1412–1420, 10.1021/acs.biomac.8b01830. doi.org/10.1021/acs.biomac.8b01830
- Yang J., Lin C., and Hwang C., “Cu2+‐Induced Blue Shift of the Pyrene Excimer Emission: A New Signal Transduction Mode of Pyrene Probes,” Organic Letters 3, no. 6 (2001): 889–892, 10.1021/ol015524y. doi.org/10.1021/ol015524y
- Kim S. K., Bok J. H., Bartsch R. A., Lee J. Y., and Kim J. S., “A Fluoride‐Selective PCT Chemosensor Based on Formation of a Static Pyrene Excimer,” Organic Letters 7, no. 22 (2005): 4839–4842, 10.1021/ol051609d. doi.org/10.1021/ol051609d
- Jun E. J., Won H. N., Kim J. S., Lee K., and Yoon J., “Unique Blue Shift due to the Formation of Static Pyrene Excimer: Highly Selective Fluorescent Chemosensor for Cu2+,” Tetrahedron Letters 47, no. 27 (2006): 4577–4580, 10.1016/j.tetlet.2006.04.143. doi.org/10.1016/j.tetlet.2006.04.143
- Nakamura M., Fukuda M., Takada T., and Yamana K., “Highly Ordered Pyrene π‐Stacks on an RNA Duplex Display Static Excimer Fluorescence,” Organic and Biomolecular Chemistry 10, no. 48 (2012): 9620–9626, 10.1039/c2ob26773j. doi.org/10.1039/c2ob26773j
- Ghosh A., Sengupta A., Chattopadhyay A., and Das D., “Lysine Triggered Ratiometric Conversion of Dynamic to Static Excimer of a Pyrene Derivative: Aggregation‐Induced Emission, Nanomolar Detection and Human Breast Cancer Cell (MCF7) Imaging,” Chemical Communications 51, no. 57 (2015): 11455–11458, 10.1039/c5cc02389k. doi.org/10.1039/c5cc02389k
Republished from the open web under CC-BY. Authors: Ouchi Y, Ishii K, Sato Y, Imai Y, Matsui H, Ohtsuki T, Hakata Y, Shigeto H, Yamamura S, Kitamatsu M. Read the original.