Global Renewable Energy Infrastructure Resilience Under Climate Risks.
Accelerating global climate risks increasingly threaten renewable energy infrastructure (REI). However, little evidence on heterogeneous impacts of climate risks on REI across countries, the moderating role of REI resilience, and post-disaster recovery patterns is available, despite their critical importance for guiding resilient energy transitions and informing disaster risk governance. To address these issues, we employed dynamic panel models in 215 countries and regions from 2004 to 2022. We find that (1) climate risk significantly damages global REI, with disaster frequency and institutional resilience having mitigation effects. (2) The damage follows an inverted U-shape with increasing disaster frequency and an "N" shape with increasing disaster duration. As renewable energy generation share increases, the damage intensifies and progresses through four increasingly severe stages. (3) Economic resilience exhibits a "Creative destruction" effect in developed nations and a "Build back better" recovery in poor countries. (4) Although social resilience worsens climate disaster damage globally, high disaster frequency and institutional resilience can facilitate a "Recovery to trend" in socially advanced nations. (5) REI in South America is the most affected, followed by Asia and Africa, whereas Europe is the least impacted. Wind energy is the most vulnerable, followed by bioenergy, solar, and hydropower.
Introduction
Accelerating climate change has intensified the frequency and severity of climate risks in recent decades (Song et al.2023). Data from EM‐DAT (CRED2024) (Figure1) show a yearly increase in the number and economic losses of global climate disasters from 1977 to 2022, totaling over 10,000 extreme events and $4.47 trillion in economic losses. In response, nations globally have adopted renewable energy (RE) as a mitigation strategy. The share of RE in the energy system, including installed capacity and power generation, has gradually increased worldwide (Figure2). The International Renewable Energy Agency (IRENA) projects that 90% of the world's electricity will come from renewable sources by 2050 (IRENA2023). The concurrent trends of increasing climate risk and rising RE share underscore the critical need to enhance the climate resilience of renewable energy infrastructure (REI).
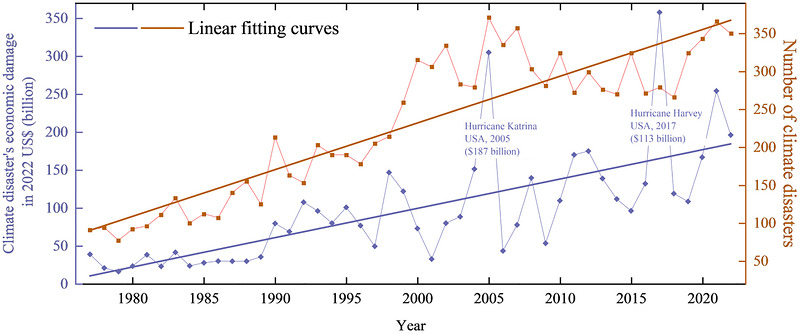
Increasing trends of global climate disasters in frequency and damage. (1) Climate disasters include drought, temperature extremes, storms, and floods and (2) data calculated by the authors using raw data from EM‐DAT, CRED.2
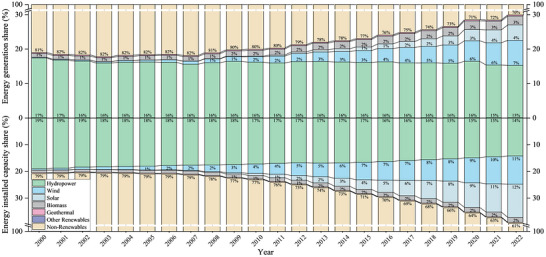
Development trends of RE generation and installed capacity. Data sourced from EIA.3
REI includes systems and facilities used to generate, store, and distribute energy from renewable sources. Infrastructure resilience refers to the capacity to withstand natural hazards (Marzi et al.2019) and return to pre‐disaster equilibrium (Khan et al.2022). However, RE systems, due to their dependence on natural resources and intermittent nature, are particularly vulnerable to extreme climate events (Chen et al.2024). Hydropower, wind power, solar power, and biomass energy, which collectively account for over 98% of RE generation (EIA2024), are sensitive to climate variables such as rainfall, wind speed, sunlight, and humidity (Wang et al.2014). For example, droughts can severely limit hydropower generation, whereas floods can disrupt their normal operations (Lee et al.2022). The reliance on natural resources makes RE generation intermittent and unstable, exposing it to climate risks (Park and Hur2018) and prolonged power outages (Bagheri et al.2019). Consequently, climate risk increases the uncertainty of RE and diminishes its performance and reliability (Fant et al.2020). Additionally, heightened climate risk can raise financing costs for RE projects, potentially reducing (Chen et al.2024) or interrupting (Agostino2024) investments, challenging the deployment of RE technologies (Dell et al.2014). Overall, climate risk can negatively impact energy‐related investments (Chen et al.2021), innovation (Chen et al.2024), efficiency (Okolo and Wen2022), deployment (Oh and Oetzel2011), and recovery (Zhao et al.2024) through direct physical damage and indirect cascading effects (see TablesS1andS2).
Although climate risk can damage REI, it can also raise awareness about disaster resilience among the public (Agostino2024), businesses (Benincasa et al.2024), and governments (Solecki et al.2019). For instance, Solecki et al. (2019) found that hurricanes can enhance future resilience and increase government support for RE deployment. Li et al. (2023) found that natural hazards positively impacted Bangladesh's sustainable development in both the short and long run. Therefore, it is worth investigating how to enhance the disaster resilience of REI and leverage the experience of climate disasters to reduce future damage, adhering to the principle of “never let a good crisis go to waste” (Agostino2024).
The literature on REI resilience can be broadly categorized into two strands: definition and assessment. There is no unified conclusion on the qualitative criteria of REI resilience. Although the IPCC (2011) proposed six elements of system resilience—economic resources, technology, information and skills, infrastructure, institutions, and equity (Smit and Pilifosova2003)—subsequent studies have introduced other assessments, such as the “Adaptive Capacity Wheel” (Gupta et al.2010), the four stages of preparation, absorption, recovery, and adaptation (Roege et al.2014), internal and external resilience (Labaka et al.2015), and even an index system including up to 196 evaluation indicators (Sharifi and Yamagata2016). However, given the data unavailability, quantitative studies are often limited to micro‐systems (Bagheri et al.2019) or regional levels (Wang et al.2014).
Given the lack of a dedicated assessment framework for REI resilience in the current literature, this article synthesizes current research on system resilience (Borsekova et al.2018; Gatto and Drago2020; Labaka et al.2015) and divides the unmeasured REI resilience into four dimensions: environmental, institutional, economic, and societal. We employ dynamic panel models to analyze the impact of global climate disaster events on REI across 215 countries and regions from 2004 to 2022 and examine the mitigating effects of REI resilience on disaster damage from these four dimensions. Additionally, we explore the heterogeneity of these dimensions across different countries and types of RE. The potential contributions of this article are as follows.We address a research gap by empirically estimating the global impact of climate risk on REI. Despite the existing research has examined the negative effects of natural hazards on infrastructures and RE (Chen et al.2024; Rahman2018; Taghizadeh‐Hesary et al.2021), the relevant studies still ignore the physical damages of climate disasters on REI which directly determines RE production and deployment. Moreover, previous studies have been limited in scope, often focusing on specific climate events (Hsiang and Jina2014), projects (Bagheri et al.2019), or regions (Wang et al.2014), which may underestimate the full impact of climate risk by overlooking potential interactions and amplification effects between different types of extreme climate events (as shown in TableS2). Given that climate risk and RE goals are global issues requiring national‐level actions, this article employs dynamic panel data of 215 major economies using climate disaster data from EM‐DAT (CRED2024) between 2004 and 2022. This approach allows for a comprehensive and global analysis of climate risk impact on REI across diverse economies.This study also addresses the understudied moderating role of REI resilience in mitigating the impacts of climate risk on REI, as few studies have quantitatively estimated the relationship between REI resilience and natural hazards (Esteban and Portugal‐Pereira2014) or climate risks (Xu et al.2024). We synthesize current REI resilience research and analyze its mitigating effects and national heterogeneity across four dimensions: environmental, institutional, economic, and societal. This comprehensive analysis fills a gap in understanding REI resilience under climate disasters and provides policy‐relevant insights for countries developing REI.Current research identifies four post‐disaster recovery patterns: “No recovery,” “Recovery to trend,” “Build back better,” and “Creative destruction” (Hsiang and Jina2014). However, quantitative studies on these recovery types for national REI remain limited. We proposed quantitative criteria based on theory and analyzed REI recovery patterns across countries, offering a reference for post‐disaster REI recovery.
The article is structured as follows: Section2reviews the relevant literature. Section3outlines the methods and data. Section4reports the results. Section5discusses the findings. The final section concludes.
Literature Review
Resilience refers to a system's ability to absorb disturbances while maintaining its core functions, structure, identity, and feedback (Borsekova et al.2018). However, the resilience of REI lacks a universally accepted definition. Contemporary resilience theory distinguishes engineering resilience (speed of return to equilibrium) (Jesse et al.2024) from social‐ecological resilience (persistence across multiple stable states with learning and adaptation) (Folke2006), emphasizing adaptive and transformative capacities governed by institutions and feedbacks. For energy infrastructure, resilience frameworks delineate system capacities into plan/prepare, absorb, recover, and adapt (Roege et al.2014). Energy system resilience includes cascading interdependencies, cyber‐physical risks, and multistage recovery (Jasiūnas et al.2021). For renewables specifically, variability and correlated weather risks pose system integration challenges (e.g., balancing variable nonfossil and conventional generation within the grid) and resource adequacy challenges (e.g., ensuring supply reliability despite renewable intermittency) at high penetration shares of variable RE (Heptonstall and Gross2021). Conversely, modularity and distributed siting can reduce single‐point failures and aid operations (Nawaz Khan and Ali Abbas Kazmi2022), whereas system‐level flexibility can lower integration costs and enhance restorative capacity after shocks (Hirth et al.2015).
Complementing resilience theory, vulnerability models conceptualize risk as a function of exposure, sensitivity, and adaptive capacity (Wang et al.2014). They quantify which components are more susceptible under given conditions, thereby providing operational indicators and assessment frameworks for defining and measuring resilience (Shen et al.2024). Specifically, exposure primarily captures the environmental dimension, which is the physical proximity of climate disaster and energy system (Jasiūnas et al.2021) and thus defines the magnitude of potential shock. Sensitivity describes how strongly system components and social groups are affected by a hazard (Niklas and Mey2023). As this depends on socio‐economic conditions, sensitivity spans the social and economic dimensions of resilience. Adaptive capacity is the ability to anticipate, absorb, reorganize, and recover (Beyza and Yusta2021) and can be further categorized into three distinct domains: institutional, economic, and societal capacities. For example, institutional capacity, comprising governance, planning, and regulation, facilitates coordinated prevention and response Gatto and Drago (2020). Economic capacity, encompassing fiscal space, insurance, market mechanisms, and investment, determines repair and reconstruction potential (Gasser et al.2021). Societal capacity, including social capital and local organization, shapes preparedness, informal coping, and recovery dynamics (Niklas and Mey2023). Therefore, conceptualizing environmental, institutional, economic, and societal resilience as distinct yet interacting dimensions maintains the underlying exposure–sensitivity–adaptive capacity logic, while also providing a theoretically grounded bridge from abstract constructs to the empirical indicators employed in this study.
Environment Resilience
Disaster damages can be influenced by environmental resilience characteristics (Ward and Shively2017), which can be divided into external and internal environments. Exposure to climate hazards, including their frequency and duration, builds disaster experience, facilitating REI resilience in response to external pressures. The development and diversity of a country's RE system represent the disaster resilience of its internal environment.
External Environment
The public (Myers et al.2013) and policymakers (Porter et al.2015) generally prefer forming inclinations based on directly observed trends and events rather than abstract climate change information. Because experience‐based disaster information, especially seasonal flood disasters (Spence et al.2011), is more readily understood (Ogunbode et al.2017) and triggers action (Marx et al.2007). Besides, climate forecasts are inherently uncertain and limited in detail (Porter et al.2015).
The impact of disaster experience on climate resilience remains inconclusive. Some studies suggest disasters significantly shape resilience (Reckien et al.2018), whereas others find no relationship (Yeganeh et al.2020). Experiences of extreme weather events can enhance public willingness to pay for climate mitigation (Gould et al.2024) and mitigation actions (Shao and Hao2024). However, frequent major disasters often have a limited impact on urban adaptation actions. As the frequency of a particular disaster increases, government preparedness for other disasters may decrease (Nohrstedt et al.2022). In other words, if multiple disasters occur simultaneously, experience from a specific disaster may not suffice for new types of disasters. Evidence shows that individuals with prolonged disaster experience perceive greater risks (Dai et al.2015) and take preemptive energy measures (Amin et al.2021), but more experience does not always improve personal disaster preparedness (Baik et al.2020), whereas governments with a history of natural hazards respond quickly in the short term but also require flexible disaster management plans for long‐term effectiveness (Li et al.2023). Overall, these conflicting views largely stem from studies limited to specific countries or regions, lacking global evidence and consideration of national heterogeneity (Nohrstedt et al.2022).
Internal Environment
The intermittency of RE generation can make electrical systems vulnerable to climate disasters (Beyza and Yusta2021), potentially causing prolonged power outages (Baik et al.2020). However, this vulnerability can be mitigated through energy portfolio diversification (Kosai and Unesaki2020) and storage systems (Esteban and Portugal‐Pereira2014).
Energy diversity is crucial for long‐term energy security (Esteban and Portugal‐Pereira2014). Over‐reliance on a single resource increases the risk of energy supply disruptions (Chuang and Ma2013). Despite this, diversified energy sources can ensure that highly dependent energy systems are not at high risk (Bhattacharyya2009) and can effectively respond to external pressures like market fluctuations and supply shortages (Chuang and Ma2013). Although traditional backup generators (diesel and natural gas) may not mitigate long‐term climate interruptions (Bagheri et al.2019), sustainable solutions (Gonzalez et al.2023) like hybrid RE systems (Thirunavukkarasu et al.2023) and battery storage systems (Esteban and Portugal‐Pereira2014) can enhance resilience to prolonged outages. For example, battery storage systems can help Japan's 100% RE system achieve post‐disaster recovery (Esteban and Portugal‐Pereira2014).
Institutional Resilience
Institutions, including governance and management structures, are key determinants of climate change adaptation (Taghizadeh‐Hesary et al.2021) and critical infrastructure resilience (Huddleston et al.2023). The impact of any disaster depends on the institution's ability to respond and recover (Borsekova et al.2018). High‐quality institutions can reduce resilience costs, enhance disaster prevention and response (Khan et al.2022), and minimize economic losses and recovery time (Agostino2024), even in underdeveloped countries (Spence2004). Stable and democratic political institutions (Sequeira and Santos2018) ensure the effective implementation of RE support policies (Chen et al.2024), potentially mitigating negative climate change impacts (Shahbaz et al.2022). Conversely, institutional corruption (Cadoret and Padovano2016) and lack of political support (Porter et al.2015) can hinder RE deployment. However, the importance of policy institutions for climate adaptation actions remains controversial (Nohrstedt et al.2022), with many studies attributing this to national heterogeneity (Cinner et al.2018; Williams et al.2015).
Economic Resilience
Economic resilience denotes the inherent and adaptive responses that allow households, firms, markets, and regions to avert potential losses during and after disasters (Rose2004). It is the fraction of losses avoided relative to a maximum potential loss (Rose2007). By mobilizing behavioral adjustments, market re‐equilibration, and financial responses, resilience dampens the translation of physical shocks into economic damage. Therefore, models that omit it overstate losses and misvalue recovery capacity (Rose2017). Economic development expands the resource buffers and adjustment margins that underpin these mechanisms and is thus central to recovery (Chen et al.2024). Empirically, higher income (Albuquerque and Rajhi2019) and capital (Mavhura et al.2021) are associated with greater disaster resilience (Khan et al.2022). A stable economic environment helps countries recover quickly from climate disasters (Chen et al.2024) and mitigate negative impacts on RE (Z. Wang, Zhang, et al.2023). Conversely, economic crises and high policy costs can lead to the abolition of RE measures (Prontera2021).
Countries with strong financial foundations and high incomes suffer less from disasters than credit‐constrained countries (McDermott et al.2014), prepare more adequately for disasters (Noy2009), and reduce vulnerability to climate change (Li et al.2023). Low‐income countries, lacking environmental reforms and climate adaptation policies, are disproportionately affected by natural hazards (Noy2009). Disaster losses can impact their infrastructure and RE by reducing foreign exchange reserves (Khan and Anwar2022). Poorer regions exhibit higher vulnerability to climate change impacts on RE due to higher opportunity costs of disaster prevention policies (Wang et al.2014). As countries develop economically, they allocate more resources to reduce disaster risks (Toya and Skidmore2007) but may compromise on infrastructure quality due to cost constraints (Rahman2018).
There are no consistent results on the role of the economic environment in disasters, primarily due to national heterogeneity (Hsiang and Jina2014). Therefore, the role of economic heterogeneity in the impact of climate risk on REI requires investigation.
Social Resilience
Social resilience to climate disasters refers to communities’ capacity to withstand, adapt to, and recover from climate events (Saja et al.2018). Regions with high social resilience demonstrate greater cohesion and inclusiveness, facilitating coordinated economic and social policies (Borsekova et al.2018). While wealthier societies generally possess superior disaster recovery capabilities, they may also face greater disaster risks due to higher exposure (Nohrstedt et al.2022). Empirical analysis suggests that social development has a limited short‐term impact on RE consumption (Khribich et al.2021). The varying capacities to manage disaster risks across regions are attributed to significant heterogeneity in social development levels (Song et al.2024), highlighting the complex relationship between social factors and climate disasters.
Interactive Dynamics Among Resilience Dimensions
The realization of REI outcomes depends on how environmental, institutional, and societal factors interact with economic capacity. On the environmental side, adequate financial resources enable portfolio diversification and flexibility, which reduces exposure to correlated hazards and aids restoration (Chuang and Ma2013; Huddleston et al.2022). On the institutional side, effective policies and competent regulators mobilize private capital for flexibility and storage upgrades, whereas institutional weaknesses amplify policy risk and stall investment (Cadoret and Padovano2016). On the societal side, household resources and community cohesion condition preparedness and the ability to cope with prolonged outages, influencing both recovery costs and the distribution of welfare losses, while enhancing the resilience of socially vulnerable groups can reduce these economic burdens (Carvallo et al.2022; Dugan et al.2023; Siegel et al.2024).
Additionally, social resilience interacts with environmental and institutional factors in determining outcomes for REI. For example, where hazard exposure intersects with social vulnerability, outage durations lengthen and recovery trajectories diverge across communities, which in turn influences public support for resilience investment (Ganz et al.2023; Gonzalez et al.2023). Nohrstedt et al. (2022) contend that the recurrence of disasters alone is insufficient for adaptation and that effective adaptation relies on institutional governance to transform experience into learning and policy change. Finally, the distribution of social resources influences the adoption of protective measures, and energy system investments are most effective when paired with community‐level strategies that improve access and participation (Carvallo et al.2022; Siegel et al.2024).
Methods
Model
Impact of Climate Risk on REI
We employ a dynamic panel model to examine the impact of climate risk on REI. A one‐period lag of REI is used as an independent variable to capture the historical accumulation effects, reflecting how current levels are influenced by past investments. This approach also addresses endogeneity concerns arising from omitted variables and potential reverse causality. To mitigate bias, we control for relevant variables, as well as time‐fixed effects (varying over time but constant across countries), country‐fixed effects (varying across countries but constant over time), and country‐specific time trends. We apply clustered robust standard errors to account for heteroscedasticity. The baseline model is
where REI and CDR represent the levels of renewable energy infrastructure and climate risks, respectively. Controls represent the vector of control variables,δt,ηi, andid×trenditrepresent time‐fixed effects, country‐fixed effects, and country‐specific time trends, respectively, whereasα0andεitrepresent the constant and the error term. The analysis spans 2004–2022, a period marked by heightened global attention to RE following the 2004 Bonn Conference.
Moderating Effect of REI Resilience
To assess how REI resilience moderates the relationship between CDR and REI, we extend the baseline model as follows:
where REI resilience represents four resilience dimensions of environmental, institutional, economic, and social, andφkrepresents the moderating effect.
REI Recovery Patterns
Following Hsiang and Jina (2014), we identify four possible post‐disaster trajectories for REI: (1) “No recovery”: Infrastructure remains persistently below its pre‐disaster path, as fiscal stress and higher risk premia depress investment for years, leaving REI development lagging behind; (2) “Recovery to trend”: Temporary losses are erased as investment resumes and REI eventually rejoins the pre‐disaster growth path; (3) “Build back better”: Reconstruction improves quality and reduces future risks. The Sendai Framework defines it as using recovery and reconstruction to raise standards and reduce future risk without necessarily changing the economic structure (UNISDR2015); (4) “Creative destruction”: Obsolete capital is replaced by higher productivity technologies through structural reallocation, delivering the highest post‐disaster REI levels and exceeding the “Build back better” outcome. This trajectory emerges when disasters accelerate capital turnover, embed superior vintages of renewables, storage, and controls, exploit learning curves and deployment‐driven cost declines (Way et al.2022), and enable system‐wide network reoptimization rather than mere hardening (Hallegatte and Dumas2009). Hsiang and Jina (2014) emphasize that “Creative destruction” is conditional and requires combinations of economic and policy resilience to channel reconstruction into transformational upgrades.
As shown in Figure3, we use the current and lagged impacts of climate disasters on REI as the horizontal and vertical axes, respectively, to depict the four recovery trajectories. When the current impact (μt) is positive, the REI trajectory lies above the predicted trend, corresponding to the “Creative destruction” pattern. Whenμtis negative but the lagged impact (μt−n) is positive and greater than |μt|, post‐disaster recovery exceeds the initial damage, reflecting a “Build back better” outcome. Conversely, ifμtis negative andμt−nis positive but smaller than |μt|, the process represents a “Recovery to trend.” Finally, when bothμtandμt−nare negative, the REI exhibits “No recovery.”
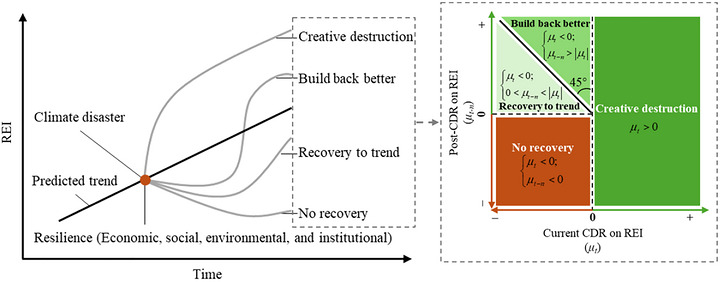
Recovery of REI after climate disasters. A negative value means significant damage to REI, whereas a positive value means recovery or promotion. REI, renewable energy infrastructure.
Variable Selection
Dependent and Core Independent Variables
For REI, indicators adopted by previous research include installed capacity (Kersey et al.2021), RE generation share (Ly2025), and per capita RE generation (Calcaterra et al.2024). Installed capacity reflects the scale of facilities but not generation efficiency or utilization. High capacity may not translate to high output due to technical or climatic conditions (Frew et al.2021). The RE generation share also omits population effects, and a high share does not necessarily imply high generation capacity (Pappis et al.2021). Per capita RE generation, by contrast, accounts for both total capacity and population, providing a comprehensive measure (Calcaterra et al.2024). Thus, we use it as the proxy for REI. As a robustness check, we also use total RE generation as a proxy for REI. Geothermal power, minimally affected by climate risk and contributing less than 2% to total RE, is excluded. Our measure, therefore, aggregates solar, wind, hydro, and biomass, which together comprise over 98% of global RE output. Data come from IRENA'sRenewable Energy Statistics(IRENA2023), a dataset widely employed in cross‐country analyses (Egli et al.2023).
The impact of climate risk is typically measured by economic losses, the proportion of the affected population, and the mortality rate (Lee et al.2021; Rahman2018). However, economic losses depend on the region's development level, distorting cross‐regional comparisons. UNDRR (2019)’sGlobal Assessment Reportexplains that increases in recorded monetary losses can stem from high values of exposed assets and should not be confused with high risk. The proportion of the affected population reflects disaster coverage but can overestimate severity when mildly affected individuals dominate. UNDRR (2017) states that “affected” includes people injured, ill, evacuated, or displaced, and those with disrupted livelihoods, which is a broad set that can swell counts even when most cases are minor. In contrast, the mortality rate directly captures the threat to life and provides a more objective measure of disaster severity (Felbermayr and Gröschl2014). Therefore, we use the mortality rate to assess climate disaster severity. Climate disasters include floods (from heavy rain, glacier melt, hurricanes, etc.), storms, droughts, and extreme temperatures. Mortality rate is constructed as disaster deaths per country–year divided by total population. Deaths come from EM‐DAT (CRED2024), a widely used database with standardized inclusion criteria (≥10 deaths, ≥100 affected/injured/homeless, or a state of emergency/international appeal), ensuring reliability (Delforge et al.2025).
Control Variables
To minimize confounding effects, we control for the following seven variables:Economic level (PGDP): Economic development provides the fiscal basis for infrastructure and deployment, and higher income and activity levels are strongly associated with RE expansion (Sadorsky2009). Accordingly, per‐capita GDP is widely used as a key driver in empirical studies (Bourcet2020). Wealthier nations possess more resources for REI, whereas poorer countries, facing resource constraints, prioritize disaster resilience over RE goals. We measure this using per capita GDP (constant 2015 US$). Data come from World Bank WDI (World Bank2024), an internationally harmonized database with transparent sources and methods.RE endowment (L.REI): RE development is determined by a country's energy endowment. REI exhibits significant persistence and path dependence, as existing capacity and industrial chains drive subsequent additions. Therefore, including a one‐period lag in the dynamic panel (Berk et al.2020) provides a reasonable way to capture such endogenous inertia (Bölük and Kaplan2022).Energy consumption (EC): Per‐capita EC reflects underlying demand and pressures for electricity expansion, thereby spurring substitution and incremental REI (Damette and Marques2019). Panel evidence for Asian countries also shows a statistically significant link between EC and renewable use (Hoa et al.2023). We measure this using per‐capita EC from the US Energy Information Administration (EIA2024), the Department of Energy's independent statistical agency, whose indicators are widely used in policy and research.Population size (Pop): Population size directly raises electricity demand, creating strong energy expansion pressures (Zaman et al.2012). A large population increases energy demand and supports economies of scale, promoting REI development. The data come from the World Bank's WDI (World Bank2024).Openness (Open): Trade openness facilitates access to RE technology and capital, reducing the cost of REI development and promoting its expansion (Zhang et al.2021). We use the trade share of GDP to measure openness, which comes from the World Bank's WDI (World Bank2024).Foreign direct investment (FDI): FDI provides financial capital and introduces advanced technology and management practices critical for large‐scale RE projects (Tan et al.2022). The data come from the World Bank's WDI (World Bank2024).Industrial structure (IS): Energy‐intensive industries demand more energy, spurring REI development (Rissman et al.2020). At the macro level, industrial infrastructure investment has been identified as an important positive driver of RE development (Y. Wang, Wang, et al.2023). We use the proportion of industrial output to GDP as a proxy for IS. The data come from the World Bank's WDI (World Bank2024).
Moderating Variables
As discussed, we categorize REI resilience into environmental, institutional, economic, and social dimensions.
Environmental Resilience
This dimension is further divided into external and internal resilience. External resilience is measured by the frequency and average duration of climate disasters, as recurrent and prolonged events enhance disaster experience (Onuma et al.2017), thereby strengthening subsequent adaptation (Van Loon et al.2024). Frequent exposure to disasters compels governments, businesses, and individuals to refine risk management strategies, thereby improving their preparedness for future events. Consequently, higher frequencies and longer durations may strengthen external environmental resilience. The data come from EM‐DAT (CRED2024). Internal resilience is represented by the RE power generation share in total energy. A high RE share indicates advanced RE processes but also highlights potential energy security risks due to over‐reliance on renewables (Esteban and Portugal‐Pereira2014). The data come from IRENA (2023).
Institutional Resilience
This is captured by the incentives and regulatory support index for RE. Unlike broad institutional indicators such as corruption control and government efficiency, this index directly reflects the support policies and institutions provide for RE development. Clear and stable policy instruments, such as feed‐in tariffs, renewable portfolio standards, and auctions, reduce risks and increase returns, thereby mobilizing private capital and accelerating REI deployment (Polzin et al.2019). Institutional strength and policy stability are thus preconditions for renewable electricity growth and diffusion (Lyon2016). We measure this factor using Regulatory Indicators for Sustainable Energy (RISE) (World Bank Group2024), a World Bank policy scorecard with transparent, question‐based methodology and equal‐weight aggregation, and the renewables pillar averages indicator scores (0–100). It is updated in periodic global reports and used in peer‐reviewed research (Drago and Gatto2022; Gatto and Drago2020).
Economic Resilience
Per‐capita GDP is a standard proxy for economic resilience. Richer countries have greater fiscal space, infrastructure quality, and administrative capacity to finance REI, preparedness, and recovery (Kahn2005). Cross‐country evidence shows high income reduces disaster mortality and losses (Toya and Skidmore2007), and that poorer economies suffer larger post‐disaster output declines (Noy2009). IPCC (2011) also identifies economic wealth as a core determinant of adaptive capacity. Thus, per capita GDP serves as a proxy for a country's economic resilience to climate risk.
Social Resilience
The Human Development Index (HDI) aggregates three social dimensions of health, education, and standard of living via a geometric mean, explicitly framing human development in social terms (UNDP2024). These dimensions are the quintessential social dimensions, which underpin adaptive capacity. Therefore, HDI is a defensible proxy for social resilience in cross‐country analyses. Kaushik et al. (2024) suggest that high national HDI is associated with low disaster mortality, which reflects how improvements in HDI enhance a society's overall capacity to adapt and recover from disasters.
To maximize coverage across 215 countries and maintain a balanced panel, the data are from 2004 to 2022. For the missing 2022 RE share, we apply the average of the preceding 3 years, which is recommended by UN agencies for country indicators to reduce year‐to‐year noise (Food and Agriculture Organization2019). Descriptive statistics for all variables considered in this study are presented in Table1.
Table: Descriptive statistics.
Results
The Impacts of Climate Risk on REI
Table2presents the results from our empirical models. Regardless of whether control variables are included or whether three types of fixed effects (country, year, and country's time trend) are applied, all models (1–4) consistently demonstrate that global climate risk significantly damages REI at the 1% level. Specifically, a 1% increase in climate risk death rates is associated with a reduction in REI ranging from 1.93% to 9.78%.
Table: The impacts of climate risk on renewable energy (RE) infrastructure development.
Notably, when moving from Models 1 and 2 to Models 3 and 4 by incorporating three‐dimensional fixed effects, theR2increases, whereas several control variables that were significant in Model 2 lose statistical significance. This suggests that these fixed effects capture much of the variation previously explained by the control variables and other unobserved confounding factors. Consequently, we adopt Model 4 as the baseline for subsequent analyses.
Robustness Analyses
To ensure robustness, we controlled as many covariates as possible, employed three‐dimensional fixed effects, and utilized cluster‐robust standard errors. Furthermore, we conducted four robustness checks, as detailed in Table3.
Table: Robustness analyses.
Although climate disasters are exogenous events posing minimal endogeneity concerns, using the mortality rate as a proxy for climate risk may still introduce endogeneity issues. For example, economic development could simultaneously affect mortality rates and REI during disasters. From a theoretical perspective, climate disasters typically precede their impact on REI, whether through direct physical damage or indirect channels, suggesting that reverse causality is unlikely. However, recent studies indicate that human activities can exacerbate climate change, increasing the frequency and intensity of climate risk, which raises concerns about potential reverse causality in our model.
To address this, we employed instrumental variable (IV) and used the dynamic panel system generalized method of moments (SGMM) estimation. Specifically, we used lagged REI and lagged climate risk as IVs. The deeper lags of REI are uncorrelated with the current error term while remaining highly correlated with the current REI. Similarly, past mortality rates are related to current mortality but are unlikely to directly influence current REI. To mitigate overfitting, we utilized the “collapse” option in Stata's “xtabond2” command to limit the number of IVs. The Arellano–Bond test results for Model 1 in Table3indicate that we cannot reject the null hypothesis of “no second‐order serial correlation,” providing evidence in support of our model specification. Additionally, the Hansen test for overidentifying restrictions suggests that we cannot reject the null hypothesis that “all instruments are valid,” further validating our instrument set. Together, these tests support the adequacy of our IVs. The result (−4.5466***) aligns with our baseline model findings.
Moreover, we performed additional robustness checks by (1) replacing the dependent variable (substituting per capita RE generation for total RE generation) (Model 2), (2) replacing the core variable by substituting the mortality rate (CDR) with the number of deaths (Death), per‐capita economic loss (Loss1), economic loss per affected person (Loss2), and a composite climate risk index (ZDR) combining CDR, Loss1, and Loss2 (Models 3–6); and (3) winsorizing the top and bottom 1% of extreme values (Model 7). Finally, we conducted a 1‐year lag analysis of CDR (Model 8) and a lagged analysis of the control variables (Model 9).1
We found that when disaster intensity is measured by per capita losses or losses per affected person, the coefficients are negative, as in the case of mortality rates, but statistically insignificant (Models 4 and 5). Neumayer and Barthel (2011) argue that global disaster‐related economic losses mainly reflect variations in wealth and defensive investments rather than disaster intensity itself, and thus, using such measures may lead to biased or insignificant estimates. Similarly, Felbermayr and Gröschl (2014) highlight that loss‐based indicators are inherently correlated with GDP, which may introduce estimation bias. This may explain why our results based on economic loss indicators yield negative but statistically weak coefficients. By contrast, the composite index of climate disasters shows a significantly negative coefficient (Model 6), which is consistent with our main results. Other robustness checks also corroborate our findings, as the coefficients on climate risk remain significantly negative.
Moderating Effects of REI Resilience
Despite the significant damage inflicted by climate risk, the resilience of REI may theoretically mitigate these impacts. We analyze the moderating role of REI resilience in climate disaster damage from four perspectives: environmental, institutional, economic, and social.
Environmental Resilience
Environmental resilience of REI during disasters can be categorized into external (disaster frequency and average duration) and internal (RE share) factors. We conducted moderation analyses on these indicators (Table4) and examined the trends of disaster damage alongside variations in these factors (Figures4and5).
Table: The moderating effects of environmental resilience.
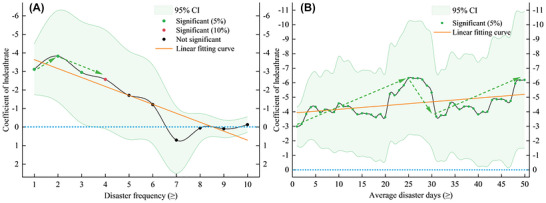
The impacts of climate risk on REI in different external environments (A) disaster frequency and (B) average disaster duration). The sign of the coefficient on theY‐axis has been reversed—the further away and up from the blue 0 line indicates greater climate damage to REI; the same approach is applied to Figure5.
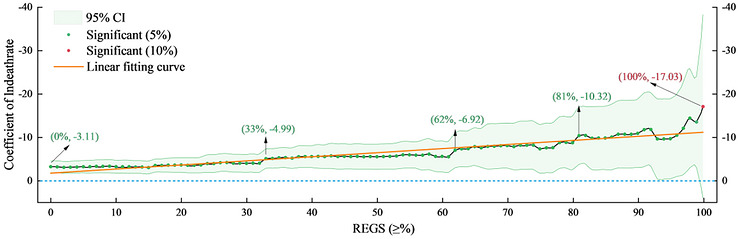
The climate hazards to REI in different internal environments (RE share).
The moderation coefficient for disaster frequency is 0.33 at the 10.9% significance level, indicating that higher disaster frequency mitigates climate damage to REI. Specifically, REI in countries experiencing more frequent disasters suffers a less negative impact. Figure4Aillustrates that the disaster impact on REI diminishes (brown line) as disaster frequency increases. The damage initially rises with one to two occurrences and then decreases with three to four occurrences, forming an inverted U‐shape. Beyond five occurrences, the damage gradually declines and eventually becomes insignificant. This finding aligns with Carleton and Hsiang (2016), who posited that while increased disaster occurrences may worsen infrastructure damage, countries with high disaster frequency tend to develop stronger resilience, ultimately leading to reduced infrastructure losses.
Model 2 reveals that average disaster duration significantly exacerbates damage, with a moderation coefficient of −0.028***. This suggests that prolonged exposure to disasters results in greater harm to REI. The trend chart (Figure4B) indicates increasing damage to REI (brown line) over time. During the initial period (1–25 days), damage rises gradually with slight fluctuations; in the middle stage (26–31 days), damage decreases, but beyond 31 days, it resumes an upward trend with slight fluctuations, forming an overall upward “N”‐shaped pattern. These findings suggest that while governments may implement disaster mitigation measures, the cumulative effects of disasters (e.g., extreme heat increasing drought risk; heavy rainfall accompanied by storms) may outweigh the benefits of such interventions (Hsiang and Jina2014).
Model 3 indicates a negative moderation from internal environmental resilience (−0.0613***), suggesting that a higher RE share amplifies disaster damages. Figure5demonstrates that disaster damage increases with rising RE share. Specifically, damage severity escalates at RE share levels of 33%, 62%, 81%, and 100%, leading to four impact intervals: 0%–32% (very small impact), 33%–61% (relatively small impact), 62%–80% (relatively large impact), and 81%–100% (very large impact). As RE share increases, a country's energy system becomes more reliant on renewable sources, which are inherently intermittent and dependent on natural resources. Consequently, REI in countries with a higher RE share is more vulnerable to climate risk. Notably, the damage for countries with a 100% RE share (−17.03*) is nearly six times that of the global average (−3.11***in the baseline model), underscoring the necessity for energy diversity in the face of climate risk.
Institutional Resilience
Table5presents moderation effect models and sub‐sample regressions for institutional resilience. The results indicate that RE institutional resilience significantly mitigates the negative impact of climate risk on REI (0.5968*), consistent with findings by Agostino (2024) and Chen et al. (2024). The climate disaster damage on REI is insignificant for the low and medium groups. However, in countries with high RE institutional resilience, the impact of climate risk on REI is positive. This suggests that strong institutional resilience not only reduces disaster damage but also enhances REI development, underscoring the critical role of institutional factors.
Table: Moderating effects and quantile regressions of institutional resilience.
Economic Resilience
Table6shows that the moderation effect of economic resilience is negative (−1.8051***), indicating that economic resilience amplifies the damage of climate risk on REI. Subsample regression results reveal that climate damage is not significant in poor countries. In middle economically developed countries, climate risk significantly damages REI, whereas in developed countries, they promote REI development. Poor countries often prioritize resources for economic and social recovery during disasters and direct investments toward low‐cost energy sources rather than eco‐friendly RE. Similarly, middle‐level countries may pursue rapid urbanization by potentially compromising quality, thus increasing vulnerability to disasters (Rahman2018). Developed countries, with strong economic resilience, can mobilize sufficient resources to restore REI post‐disaster.
Table: Moderating effects of economic resilience with quantile regressions.
Social Resilience
Results in Table7indicate that social resilience exacerbates the climate disaster damage, particularly in countries with high social resilience (−2.7796**). In contrast, damage in countries with low and medium social resilience is smaller and not significant. Nohrstedt et al. (2022) argue that countries with high social development may face greater disaster risks due to increased exposure.
Table: Moderating effects of social resilience with quantile regressions.
Heterogeneity Analysis
A strong REI resilience is generally expected to mitigate climate disaster damage. However, our findings reveal that both economic and social resilience exhibit counterintuitively negative moderation effects. Additionally, the results vary across different economic and social groups, which is primarily due to national heterogeneity in these dimensions (Hsiang and Jina2014; Song et al.2024). Consequently, we conducted a deeper analysis of countries at different economic and social levels, examining the moderating roles of environmental and institutional resilience, along with their recovery patterns. The results are presented in Tables8and9.
Table: Environmental and institutional resilience on different economic and social levels.
Table: The damage of CDR to renewable energy infrastructure (REI) over time.
Economic Level
Models 1, 4, 7, and 10 demonstrate that in countries with low economic levels, the climate disaster damage to REI is insignificant, with neither environmental nor institutional resilience altering this outcome.
In middle‐level economic countries, an increased frequency of disasters correlates with reduced damage (Model 2), and RE institutional resilience also mitigates losses (Model 11). However, longer disaster durations and higher RE share lead to greater damage (Models 5 and 8). This indicates that while middle‐level economic countries may learn from disasters and leverage institutional support to restore REI, their response capabilities are limited and vulnerable when disasters are prolonged and when they rely heavily on RE.
For developed countries, climate risk can positively influence REI, with disaster frequency enhancing this effect (Model 3). This suggests that developed countries possess strong adaptive and recovery capacities, as well as the ability to learn from disasters. However, similar to middle‐level economic countries, those with a higher RE share experience greater damage (Model 9), indicating that a heavy reliance on RE can render energy systems more vulnerable to climate risk.
Overall, economic resilience plays a critical role in the capacity of REI to withstand climate disaster exposure, with developed countries exhibiting strong resilience against such risks.
Social Development
The results indicate that disaster frequency exacerbates climate disaster damage in low HDI countries (Model 13). However, other moderating variables, including disaster duration, RE share, and RE policy resilience, do not significantly affect low and middle‐HDI countries (Models 14, 16, 17, 19, 20, 22, 23).
In high HDI countries, disaster frequency alleviates the climate disaster harm (Model 15), reflecting their strong learning capacity in the aftermath of disasters. Additionally, RE institutional resilience similarly mitigates damage (Model 24), suggesting that in socially developed countries, institutional frameworks can effectively enhance the disaster resistance capacity of REI.
In summary, although REI in socially developed countries may still incur climate disaster damage, such damage can be mitigated through increased disaster frequency and robust institutional resilience. Conversely, there is no evidence to support that REI resilience alleviates disaster losses in less socially developed countries.
REI Recovery Patterns
On the basis of the aforementioned framework (Figure3), we estimated REI recovery patterns over 1 and 2 years by economic and social levels (Table9). Developed countries show “Creative destruction,” poor ones display “Build back better,” and middle‐level economic countries exhibit either “No recovery” or “Recovery to trend.” For social levels, high social level countries tend to be “Recovery to trend” despite initial damage, whereas low and medium social level countries remain “Uncertain” due to insignificant coefficients.
Geographical Location
As climate risk and RE resources are influenced by natural and geographical conditions, we also conducted heterogeneity analyses based on geographical location and RE types.
Table10presents a geographical analysis of the impact of climate risk on REI. South American countries experience the most significant damage (−5.6579**). This is followed by Asia (−3.0721*) and Africa (−2.2040**), whereas Europe shows the least impact (−1.3004***). In North America and Oceania, the coefficients are −0.7602 and −1.6043, respectively, but neither is statistically significant.
Table: Heterogeneous effects of climatic disasters on renewable energy infrastructure (REI).
As illustrated in Figure6E, these disparities may stem from the relatively low economic development levels in South America, Asia, and Africa, which contribute to inadequate infrastructure investment, maintenance, and technology, thereby increasing vulnerability to climate risk. In contrast, North America (particularly the United States and Canada) and Oceania (mainly Australia and New Zealand) benefit from high economic development levels, enabling substantial investment in and maintenance of high‐standard infrastructure.
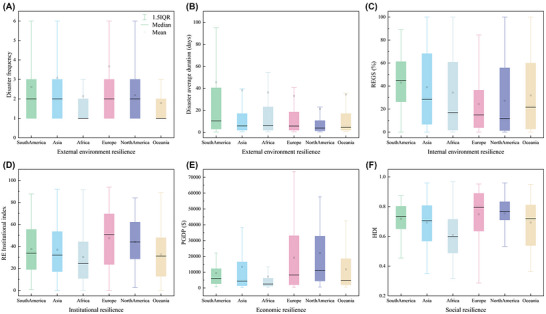
REI resilience of countries. HDI, Human Development Index; RE, renewable energy. Figures A–C show external environment resilience (i.e. disaster frequency and average disaster duration) and internal environment resilience. Figures D–F show institutional, economic and social resilience.
Moreover, South America significantly surpasses other continents in both disaster duration and RE share (Figure6B,C), as indicated by the mean and median values. Our earlier findings demonstrate that these environmental factors can exacerbate disaster severity, potentially accounting for South America's pronounced impact. Additionally, the top three most severely affected regions—South America, Asia, and Africa—exhibit significant deficiencies in institutional and economic resilience compared to Europe (Figure6D,E). However, although Europe excels in many areas, it also experiences the highest average disaster frequency (Figure6A), which may explain its significant impact from climate risk.
RE Types
All four major RE types are significantly affected by climate risk, with wind energy facing the greatest impact, followed by bioenergy, solar energy, and hydropower. This finding underscores the substantial effects of climate risk across all RE resources, as detailed in TableS1. It highlights the necessity for countries to remain vigilant regarding the impacts of climate risk, irrespective of national heterogeneities.
Discussions and Implications
Climate disasters, including floods, storms, and extreme temperatures, pose significant threats to existing REI. It not only incurs immediate repair costs but also deters investors and developers from future projects in disaster‐prone areas. Additionally, such disasters disrupt supply chains, transportation, and labor necessary for the construction and maintenance of REI. This study confirms that climate risk significantly hinders REI development through a series of robustness analyses.
Many researchers argue that REI resilience can effectively mitigate disaster damage. By categorizing REI resilience into environmental, institutional, economic, and social aspects, our findings show that the climate disaster damage to REI can indeed be alleviated through institutional resilience and certain environmental factors.
Environment Resilience
The frequency and duration of disasters initially exacerbate the harm caused by climate events to REI; however, as these factors reach a certain threshold, the extent of the damage may decrease. Our results suggest that moderate disaster frequency and duration allow countries to learn from previous disasters and improve predictive awareness, disaster preparedness, infrastructure design, and response strategies (Dai et al.2015; Neil Adger et al.2005). Consequently, as external environmental resilience strengthens, damage to REI is alleviated. Furthermore, moderate disasters can stimulate investments in REI. When governments recognize a manageable pattern of recurring disasters, they are more likely to allocate resources toward building resilient infrastructure capable of withstanding future events (Hallegatte2009).
However, as disaster frequency increases, the moderating effect diminishes, eventually reaching statistical insignificance, whereas the negative impact of disaster duration continues to worsen. This suggests that as disaster frequency escalates, the adaptive capacity of governments and institutions may reach a threshold where the financial, human, and technical resources required to cope with frequent disasters become overstretched. This strain may lead to reduced investments in REI (Chen et al.2024) or even disruptions in ongoing projects (Agostino2024). Prolonged disasters can impose long‐term stress on REI, depleting its redundancy and creating complex systemic risks that are challenging to manage. Such risks include continuous depletion of infrastructure resources, supply chain disruptions, population displacement, and cascading failures of infrastructure systems (Agostino2024). The cumulative effect of these risks can overwhelm even well‐prepared, economically resilient countries (Helbing2013). Therefore, disaster management plans should prioritize addressing frequent and prolonged disasters, including the development of multi‐layered defense systems.
Our findings indicate that countries with a high dependency on RE are more vulnerable to climate risk, irrespective of their socio‐economic development levels. This highlights the significant disaster risks associated with a heavy reliance on a single category of energy. REI, including wind turbines, solar panels, and hydropower dams, tends to be more exposed to environmental conditions than traditional energy sources (e.g., fossil fuels), making them more susceptible to damage from extreme weather events (Panteli and Mancarella2015a; Stirling2010). If a climate disaster disrupts the dominant energy source, the lack of viable alternatives can lead to prolonged power outages (Blazquez et al.2018). Additionally, the interconnections between energy supply disruptions and broader economic, social, and environmental systems can trigger severe butterfly effects, including unemployment, reduced economic activity, and social unrest, to the extent that even leading European nations might reconsider previously adopted RE measures (Prontera2021).
Thus, countries, especially those with a high RE share, should not rely solely on RE. Instead, they should invest in a diversified energy mix that includes energy sources less susceptible to climate risk, such as nuclear energy and certain fossil fuels. Furthermore, Esteban and Portugal‐Pereira (2014) confirm the feasibility of 100% RE systems supplemented by battery storage solutions in post‐disaster recovery. Therefore, hybrid RE systems that diversify the energy supply present a viable solution.
Institutional Resilience
Our findings indicate that institutional resilience not only mitigates climate disaster damage to REI but also fosters its development in countries with high RE institutional resilience. This suggests that institutional resilience plays a critical role in withstanding, recovering from, and advancing REI post‐disaster, consistent with the conclusions of Khan et al. (2022). A stable political environment ensures effective implementation of RE support policies (Chen et al.2024), thereby reducing the adverse impacts of climate change on RE systems (Shahbaz et al.2022).
Specifically, high institutional resilience typically encompasses robust post‐disaster recovery frameworks, including financial aid, reconstruction incentives, and technical support for damaged REI. These frameworks not only facilitate the restoration of damaged infrastructure but also create opportunities for upgrades and resilience enhancements, resulting in advanced and disaster‐resistant REI (Hallegatte et al.2016). Furthermore, stable, effective, and flexible policy frameworks during and after disasters can foster institutional innovation (Chen et al.2024) and encourage continuous investment (Porter et al.2015).
Economical Resilience
Our analysis reveals that the initial damage from climate risk is insignificant for poor countries but significant for middle‐level economic countries. Much of the existing literature suggests that poorer regions are more vulnerable to environmental shocks (Hallegatte and Rozenberg2017), whereas wealthier regions tend to be better protected (Hallegatte et al.2013). Hallegatte et al. (2020) note that poor populations, although highly vulnerable, often record small asset losses simply because there is less to lose. Uzar (2020) argues that economic capacity constraints hinder the uptake and implementation of RE support schemes, limiting the effectiveness of formal incentives. These studies imply that limited economic capacity reduces both the exposure of poor populations and the effectiveness of formal policy incentives, thus helping explain why, in our sample, environmental and institutional resilience did not enhance REI in poor countries. However, Felbermayr and Gröschl (2014) found that only developed countries experience negative impacts from droughts and storms. Rahman (2018) argues that poor countries often construct temporary and vulnerable infrastructure to meet minimum needs, while rapidly developing middle‐level economic countries may compromise infrastructure quality due to cost constraints. Our findings regarding REI support this argument, indicating the need for governments to prioritize the quality and resilience of REI rather than merely increasing its quantity. In middle‐level countries, high disaster frequency is associated with low REI damage, and strong institutional resilience further mitigates losses, whereas long disaster duration and high RE share increase damage. The frequency–learning channel aligns with global evidence that repeated shocks sometimes catalyze policy and capability upgrading once state capacity crosses a threshold (Skidmore and Toya2002). The institutional result is consistent with evidence that credible, well‐designed RE policies (e.g., feed‐in tariffs) accelerate RE deployment and associated capability building (Jenner et al.2013), yet other work highlights the heterogeneous importance of institutional resilience in shaping the effect of disaster experience on adaptation (Nohrstedt et al.2022). By contrast, the damage from long disaster durations and high RE share aligns with power‐system evidence that prolonged events and high‐penetration variable renewables increase compounding failures and meteorological sensitivity (Panteli and Mancarella2015b) unless supported by adequate flexibility (Van Der Wiel et al.2019). Therefore, resilience strategies in low‐income countries should focus on building capacity and expanding access to finance to enable institutional tools, such as tariffs, auctions, and standards, to take hold.
Despite insignificant initial damage, climate risk in poor countries promoted REI growth over the following 2 years, reflecting a “Build back better” pattern. This likely results from underdeveloped REI, making it easier to install modern systems that surpass pre‐disaster levels. In contrast, medium‐level economic countries are more likely to focus on restoring existing infrastructure, leading to “Recovery to trend” or “No recovery” patterns.
Notably, climate risk can promote REI development in developed countries, underscoring the importance of economic resilience in enhancing the risk resistance of REI. These countries take advantage of the financial and technical resources (Noy2009) necessary to construct high‐quality, disaster‐resistant REI. The influx of international aid and increased attention post‐disaster often provide opportunities for infrastructure upgrades rather than simple restoration (Carley et al.2017). This finding aligns with Hsiang and Jina (2014)’s “Creative destruction” hypothesis, highlighting the role of economic development in post‐disaster recovery. However, even in economically resilient countries, a high RE share can create vulnerabilities, as renewable sources, particularly solar and wind energy, are sensitive to extreme weather events. In the absence of a diversified energy mix or adequate storage systems, climate risk can lead to significant disruptions. Therefore, these countries should aim to diversify their energy mix, integrating RE with other sources to ensure backup during extreme weather events.
Social Resilience
Our analysis reveals that social resilience can exacerbate the climate disaster damage to REI. This finding aligns with the empirical results of Khribich et al. (2021) and Nohrstedt et al. (2022), who argue that social development does not significantly contribute to RE development. High social resilience indicates a deeply integrated and complex socio‐economic system. This interconnectedness means that climate risk not only damages REI but also triggers severe cascading effects on society and the economy, thereby exacerbating the damage. However, high‐social‐level countries recover significantly within 1 year, showing a “Recovery to trend.” We also observe that in these countries, disaster frequency and institutional support can significantly mitigate this damage. This is consistent with findings from Nohrstedt et al. (2022), which suggest that wealthier nations, despite facing greater disaster exposure risks, possess better governance capabilities for disaster recovery. This coheres with Aldrich (2011)’s research showing that denser social capital and stronger civic networks predict more effective post‐disaster recovery. Consequently, the disaster experience accumulated from frequent exposure and institutional advantages can effectively enhance responses to climate events in socially cohesive contexts. In contrast, weak social cohesion in low‐ and medium‐social‐level countries may hinder recovery, leading to uncertain outcomes.
Conclusions
Accelerating global climate risk poses increasing threats to REI. The heterogeneous impacts of climate risk on REI across different countries and the moderating role of REI resilience have not been empirically analyzed. To address these issues, this study established dynamic panel empirical models based on a dataset encompassing 215 countries and regions from 2004 to 2022, yielding the following main conclusions:Climate risk significantly impedes global REI development, as confirmed by various robustness analyses.The climate disaster damage to REI is mitigated by the disaster frequency. As frequency rises, climate damage increases, then decreases, ultimately becoming insignificant, revealing an inverted U‐shaped relationship. Differently, the average duration of disasters exacerbates climate disaster damage, initially increasing and then fluctuating upward, resembling an “N” trend. Additionally, as the RE share increases, the damage intensifies, progressing through four increasingly severe stages.Institutional resilience mitigates climate disaster damage to REI. Notably, in countries with high RE institutional resilience, climate risk can promote REI development.Economic resilience, while often amplifying global climate disaster impacts, can foster REI growth in developed countries, resulting in a “Creative destruction” recovery pattern, especially when disaster frequency and duration intensify this effect. For poor countries, disasters can similarly promote long‐term REI growth despite insignificant initial damage, showing a “Build back better” pattern.Social resilience tends to exacerbate climate disaster damage, particularly in high‐social level countries, but disaster frequency and institutional resilience can mitigate this effect, fostering a “Recovery to trend” pattern within 1 year.South American countries experience the most significant climate disaster damage to REI, followed by Asia and Africa, with Europe being the least affected. Additionally, wind energy infrastructure is the most impacted, followed by bioenergy, solar energy, and hydropower.
This article analyzes the moderating roles of REI resilience and the heterogeneity across different economic and social conditions. However, the interactions among the driving factors of REI development may be more complex than captured in this analysis. Future research should consider methods capable of handling high‐dimensional data and analyzing causal complexity, such as machine learning or qualitative comparative analysis.
Author Contributions
Jingke Hong: investigation, data curation, writing – original draft preparation.Yang Chen: methodology, software, writing – reviewing and editing.Wen Yi: conceptualization, supervision, validation, writing – reviewing and editing.Hung‐lin Chi: writing – reviewing and editing.
Conflicts of Interest
The authors declare no conflicts of interest.
References
- Agostino, M. 2024. “Extreme Weather Events and Firms' Energy Practices. The Role of Country Governance. ”Energy Policy192: 114235. . doi.org/10.1016/j.enpol.2024.114235
- Albuquerque, P. H. , andW. Rajhi. 2019. “Banking Stability, Natural Disasters, and State Fragility: Panel VAR Evidence From Developing Countries. ”Research in International Business and Finance50: 430–443. . doi.org/10.1016/j.ribaf.2019.06.001
- Aldrich, D. P. 2011. “The Power of People: Social Capital's Role in Recovery From the 1995 Kobe Earthquake. ”Natural Hazards56: 595–611. . doi.org/10.1007/s11069-010-9577-7
- Amin, S. B. , M. I. Chowdhury, S. M. Asif Ehsan, andS. M. Zahid Iqbal. 2021. “Solar Energy and Natural Disasters: Exploring Household Coping Mechanisms, Capacity, and Resilience in Bangladesh. ”Energy Research & Social Science79: 102190. . doi.org/10.1016/j.erss.2021.102190
- Bagheri, M. , S. H. Delbari, M. Pakzadmanesh, andC. A. Kennedy. 2019. “City‐Integrated Renewable Energy Design for Low‐Carbon and Climate‐Resilient Communities. ”Applied Energy239: 1212–1225. . doi.org/10.1016/j.apenergy.2019.02.031
- Baik, S. , A. L. Davis, J. W. Park, S. Sirinterlikci, andM. G. Morgan. 2020. “Estimating What US Residential Customers Are Willing to Pay for Resilience to Large Electricity Outages of Long Duration. ”Nat Energy5: 250–258. . doi.org/10.1038/s41560-020-0581-1
- Benincasa, E. , F. Betz, andL. Gattini. 2024. “How Do Firms Cope With Losses From Extreme Weather Events?”Journal of Corporate Finance84: 102508. . doi.org/10.1016/j.jcorpfin.2023.102508
- Berk, I. , A. Kasman, andD. Kılınç. 2020. “Towards a Common Renewable Future: The System‐GMM Approach to Assess the Convergence in Renewable Energy Consumption of EU Countries. ”Energy Economics87: 103922. . doi.org/10.1016/j.eneco.2018.02.013
- Beyza, J. , andJ. M. Yusta. 2021. “The Effects of the High Penetration of Renewable Energies on the Reliability and Vulnerability of Interconnected Electric Power Systems. ”Reliability Engineering & System Safety215: 107881. . doi.org/10.1016/j.ress.2021.107881
- Bhattacharyya, S. C. 2009. “Fossil‐Fuel Dependence and Vulnerability of Electricity Generation: Case of Selected European Countries. ”Energy Policy, China Energy Efficiency37: 2411–2420. . doi.org/10.1016/j.enpol.2009.02.031
- Blazquez, J. , R. Fuentes‐Bracamontes, C. A. Bollino, andN. Nezamuddin. 2018. “The Renewable Energy Policy Paradox. ”Renewable and Sustainable Energy Reviews82: 1–5. . doi.org/10.1016/j.rser.2017.09.002
- Bölük, G. , andR. Kaplan. 2022. “Effectiveness of Renewable Energy Incentives on Sustainability: Evidence From Dynamic Panel Data Analysis for the EU Countries and Turkey. ”Environmental Science and Pollution Research International29: 26613–26630. . doi.org/10.1007/s11356-021-17801-y
- Borsekova, K. , P. Nijkamp, andP. Guevara. 2018. “Urban Resilience Patterns After an External Shock: An Exploratory Study. ”International Journal of Disaster Risk Reduction31: 381–392. . doi.org/10.1016/j.ijdrr.2018.05.012
- Bourcet, C. 2020. “Empirical Determinants of Renewable Energy Deployment: A Systematic Literature Review. ”Energy Economics85: 104563. . doi.org/10.1016/j.eneco.2019.104563
- Cadoret, I. , andF. Padovano. 2016. “The Political Drivers of Renewable Energies Policies. ”Energy Economics56: 261–269. . doi.org/10.1016/j.eneco.2016.03.003
- Calcaterra, M. , L. Aleluia Reis, P. Fragkos, et al. 2024. “Reducing the Cost of Capital to Finance the Energy Transition in Developing Countries. ”Nat Energy9: 1241–1251. . doi.org/10.1038/s41560-024-01606-7
- Carleton, T. A. , andS. M. Hsiang. 2016. “Social and Economic Impacts of Climate. ”Science353: aad9837. . doi.org/10.1126/science.aad9837
- Carley, S. , E. Baldwin, L. M. MacLean, andJ. N. Brass. 2017. “Global Expansion of Renewable Energy Generation: An Analysis of Policy Instruments. ”Environmental & Resource Economics68: 397–440. . doi.org/10.1007/s10640-016-0025-3
- Carvallo, J. P. , N. M. Frick, andL. Schwartz. 2022. “A Review of Examples and Opportunities to Quantify the Grid Reliability and Resilience Impacts of Energy Efficiency. ”Energy Policy169: 113185. . doi.org/10.1016/j.enpol.2022.113185
- Chen, J. , X. Luo, andQ. Ding. 2024. “Climate Risk and Renewable Energy Technological Innovation: An Institutional Environment Perspective. ”Risk Analysis44: 566–581. . doi.org/10.1111/risa.14194
- Chen, X. , Q. Fu, andC. ‐P. Chang. 2021. “What Are the Shocks of Climate Change on Clean Energy Investment: A Diversified Exploration. ”Energy Economics95: 105136.
- Chuang, M. C. , andH. W. Ma. 2013. “Energy Security and Improvements in the Function of Diversity Indices—Taiwan Energy Supply Structure Case Study. ”Renewable and Sustainable Energy Reviews24: 9–20. . doi.org/10.1016/j.rser.2013.03.021
- Cinner, J. E. , W. N. Adger, E. H. Allison, et al. 2018. “Building Adaptive Capacity to Climate Change in Tropical Coastal Communities. ”Nature Climate Change8: 117–123. . doi.org/10.1038/s41558-017-0065-x
- CRED. 2024. EM‐DAT. CRED.
- Dai, J. , M. Kesternich, A. Löschel, andA. Ziegler. 2015. “Extreme Weather Experiences and Climate Change Beliefs in China: An Econometric Analysis. ”Ecological Economics116: 310–321. . doi.org/10.1016/j.ecolecon.2015.05.001
- Damette, O. , andA. C. Marques. 2019. “Renewable Energy Drivers: A Panel Cointegration Approach. ”Applied Economics51: 2793–2806. . doi.org/10.1080/00036846.2018.1558359
- Delforge, D. , V. Wathelet, R. Below, et al. 2025. “EM‐DAT: The Emergency Events Database. ”International Journal of Disaster Risk Reduction124: 105509. . doi.org/10.1016/j.ijdrr.2025.105509
- Dell, M. , B. F. Jones, andB. A. Olken. 2014. “What Do We Learn From the Weather? The New Climate‐Economy Literature. ”Journal of Economic Literature52: 740–798. . doi.org/10.1257/jel.52.3.740
- Drago, C. , andA. Gatto. 2022. “Policy, Regulation Effectiveness, and Sustainability in the Energy Sector: A Worldwide Interval‐Based Composite Indicator. ”Energy Policy167: 112889. . doi.org/10.1016/j.enpol.2022.112889
- DuganJ. , D. Byles, andS. Mohagheghi. 2023. “Social vulnerability to long–duration power outages. ”International Journal of Disaster Risk Reduction85: 103501.
- Egli, F. , R. Zhang, V. Hopo, T. Schmidt, andB. Steffen. 2023. “The Contribution of Corporate Initiatives to Global Renewable Electricity Deployment. ”Nature Communications14: 4678. . doi.org/10.1038/s41467-023-40356-0
- EIA. 2024. Renewable Energy Power Generation. EIA.
- Esteban, M. , andJ. Portugal‐Pereira. 2014. “Post‐Disaster Resilience of a 100% Renewable Energy System in Japan. ”Energy68: 756–764. . doi.org/10.1016/j.energy.2014.02.045
- Fant, C. , B. Boehlert, K. Strzepek, et al. 2020. “Climate Change Impacts and Costs to U. S. Electricity Transmission and Distribution Infrastructure. ”Energy195: 116899. . doi.org/10.1016/j.energy.2020.116899
- Felbermayr, G. , andJ. Gröschl. 2014. “Naturally Negative: The Growth Effects of Natural Disasters. ”Journal of Development Economics111: 92–106.
- Folke, C. 2006. “Resilience: The Emergence of a Perspective for Social–Ecological Systems Analyses. ”Global Environmental Change16: 253–267. . doi.org/10.1016/j.gloenvcha.2006.04.002
- Frew, B. , B. Sergi, P. Denholm, et al. 2021. “The Curtailment Paradox in the Transition to High Solar Power Systems. ”Joule5: 1143–1167.
- Ganz, S. C. , C. Duan, andC. Ji. 2023. “Socioeconomic Vulnerability and Differential Impact of Severe Weather‐Induced Power Outages. ”PNAS Nexus2: pgad295. . doi.org/10.1093/pnasnexus/pgad295
- GasserP. , P. Lustenberger, M. Cinelli, et al. 2021. “A review on resilience assessment of energy systems. ”Sustainable and Resilient Infrastructure, 6, no. 5: 273–299.
- Gatto, A. , andC. Drago. 2020. “Measuring and Modeling Energy Resilience. ”Ecological Economics172: 106527. . doi.org/10.1016/j.ecolecon.2019.106527
- Gonzalez, J. M. , J. E. Tomlinson, E. A. Martínez Ceseña, et al. 2023. “Designing Diversified Renewable Energy Systems to Balance Multisector Performance. ”Nature Sustainability6: 415–427.
- Gould, R. K. , T. R. Shrum, D. Ramirez Harrington, andV. Iglesias. 2024. “Experience With Extreme Weather Events Increases Willingness‐to‐Pay for Climate Mitigation Policy. ”Global Environmental Change85: 102795. . doi.org/10.1016/j.gloenvcha.2023.102795
- Gupta, J. , C. Termeer, J. Klostermann, et al. 2010. “The Adaptive Capacity Wheel: A Method to Assess the Inherent Characteristics of Institutions to Enable the Adaptive Capacity of Society. ”Environmental Science & Policy13: 459–471. . doi.org/10.1016/j.envsci.2010.05.006
- Hallegatte, S. 2009. “Strategies to Adapt to an Uncertain Climate Change. ”Global Environmental Change, Traditional Peoples and Climate Change19: 240–247. . doi.org/10.1016/j.gloenvcha.2008.12.003
- Hallegatte, S. , andP. Dumas. 2009. “Can Natural Disasters Have Positive Consequences? Investigating the Role of Embodied Technical Change. ”Ecological Economics68: 777–786. . doi.org/10.1016/j.ecolecon.2008.06.011
- Hallegatte, S. , C. Green, R. J. Nicholls, andJ. Corfee‐Morlot. 2013. “Future Flood Losses in Major Coastal Cities. ”Nature Climate Change3: 802–806. . doi.org/10.1038/nclimate1979
- Hallegatte, S. , andJ. Rozenberg. 2017. “Climate Change Through a Poverty Lens. ”Nature Climate Change7: 250–256. . doi.org/10.1038/nclimate3253
- Hallegatte, S. , A. Vogt‐Schilb, M. Bangalore, andJ. Rozenberg. 2016. Unbreakable: Building the Resilience of the Poor in the Face of Natural Disasters. World Bank Publications.
- Hallegatte, S. , A. Vogt‐Schilb, J. Rozenberg, M. Bangalore, andC. Beaudet. 2020. “From Poverty to Disaster and Back: A Review of the Literature. ”Economics of Disasters and Climate Change4: 223–247. . doi.org/10.1007/s41885-020-00060-5
- Helbing, D. 2013. “Globally Networked Risks and How to Respond. ”Nature497: 51–59. doi.org/10.1038/nature12047
- Heptonstall, P. J. , andR. J. K. Gross. 2021. “A Systematic Review of the Costs and Impacts of Integrating Variable Renewables Into Power Grids. ”Nature Energy6: 72–83. . doi.org/10.1038/s41560-020-00695-4
- Hirth, L. , F. Ueckerdt, andO. Edenhofer. 2015. “Integration Costs Revisited—An Economic Framework for Wind and Solar Variability. ”Renewable Energy74: 925–939. . doi.org/10.1016/j.renene.2014.08.065
- Hoa, P. X. , V. N. Xuan, andN. T. Phuong Thu. 2023. “Determinants of the Renewable Energy Consumption: The Case of Asian Countries. ”Heliyon9: e22696. . doi.org/10.1016/j.heliyon.2023.e22696
- Hsiang, S. , andA. Jina. 2014. The Causal Effect of Environmental Catastrophe on Long‐Run Economic Growth: Evidence From 6, 700 Cyclones (No. w20352). National Bureau of Economic Research. . doi.org/10.3386/w20352
- Huddleston, P. , T. Smith, I. White, andC. Elrick‐Barr. 2022. “Adapting Critical Infrastructure to Climate Change: A Scoping Review. ”Environmental Science & Policy135: 67–76. . doi.org/10.1016/j.envsci.2022.04.015
- Huddleston, P. , T. F. Smith, I. White, andC. Elrick‐Barr. 2023. “What Influences the Adaptive Capacity of Coastal Critical Infrastructure Providers?. ”Urban Climate48: 101416. . doi.org/10.1016/j.uclim.2023.101416
- IPCC. 2011. Climate Change 2011. IPCC.
- IRENA. 2023. World Energy Transitions Outlook 2023: 1. 5°C Pathway. IRENA.
- Jasiūnas, J. , P. D. Lund, andJ. Mikkola. 2021. “Energy System Resilience—A Review. ”Renewable and Sustainable Energy Reviews150: 111476. . doi.org/10.1016/j.rser.2021.111476
- Jenner, S. , F. Groba, andJ. Indvik. 2013. “Assessing the Strength and Effectiveness of Renewable Electricity Feed‐in Tariffs in European Union Countries. ”Energy Policy52: 385–401. . doi.org/10.1016/j.enpol.2012.09.046
- Jesse, B. ‐J. , G. J. Kramer, andV. Koning. 2024. “Characterization of Necessary Elements for a Definition of Resilience for the Energy System. ”Energy, Sustainability and Society14: 46. . doi.org/10.1186/s13705-024-00478-9
- Kahn, M. E. 2005. “The Death Toll From Natural Disasters: The Role of Income Geography, and Institutions. ”Review of Economics and Statistics87: 271–284. . doi.org/10.1162/0034653053970339
- Kaushik, R. , Y. Parida, andR. Naik. 2024. “Human Development and Disaster Mortality: Evidence From India. ”Humanities and Social Sciences Communications11: 814. . doi.org/10.1057/s41599-024-03353-2
- Kersey, J. , P. Blechinger, andR. Shirley. 2021. “A Panel Data Analysis of Policy Effectiveness for Renewable Energy Expansion on Caribbean Islands. ”Energy Policy155: 112340. . doi.org/10.1016/j.enpol.2021.112340
- Khan, M. T. I. , andS. Anwar. 2022. “Natural Disasters and Foreign Exchange Reserves: The Role of Renewable Energy and Human Capital. ”Renewable Energy192: 838–848. . doi.org/10.1016/j.renene.2022.05.022
- Khan, M. T. I. , S. Anwar, S. A. Sarkodie, M. R. Yaseen, A. M. Nadeem, andQ. Ali. 2022. “Comprehensive Disaster Resilience Index: Pathway Towards Risk‐Informed Sustainable Development. ”Journal of Cleaner Production366: 132937. . doi.org/10.1016/j.jclepro.2022.132937
- Khribich, A. , R. H. Kacem, andA. Dakhlaoui. 2021. “Causality Nexus of Renewable Energy Consumption and Social Development: Evidence From High‐Income Countries. ”Renewable Energy169: 14–22. . doi.org/10.1016/j.renene.2021.01.005
- Kosai, S. , andH. Unesaki. 2020. “Short‐Term vs Long‐Term Reliance: Development of a Novel Approach for Diversity of Fuels for Electricity in Energy Security. ”Applied Energy262: 114520. . doi.org/10.1016/j.apenergy.2020.114520
- Labaka, L. , J. Hernantes, andJ. M. Sarriegi. 2015. “Resilience Framework for Critical Infrastructures: An Empirical Study in a Nuclear Plant. ”Reliability Engineering & System Safety141: 92–105. . doi.org/10.1016/j.ress.2015.03.009
- Lee, C. ‐C. , C. ‐W. Wang, S. ‐J. Ho, andT. ‐P. Wu. 2021. “The Impact of Natural Disaster on Energy Consumption: International Evidence. ”Energy Economics97: 105021. . doi.org/10.1016/j.eneco.2020.105021
- Lee, C. ‐C. , Z. Yuan, C. ‐C. Lee, andY. ‐F. Chang. 2022. “The Impact of Renewable Energy Technology Innovation on Energy Poverty: Does Climate Risk Matter?”Energy Economics116: 106427. . doi.org/10.1016/j.eneco.2022.106427
- Li, S. , B. Daud Ishola, S. Abbas, M. Subhan, andZ. Abduvaxitovna Shamansurova. 2023. “Building Resilience in the Face of Natural Disasters: ICT, Fossil Fuel Use, and Sustainable Development in an Emerging Economy. ”Gondwana Research124: 273–289. . doi.org/10.1016/j.gr.2023.06.018
- Ly, A. 2025. “Scaling up Renewables Without Phasing Down Fossil Fuels? Rethinking the Role of Financial Globalization. ”Energy Policy204: 114654. . doi.org/10.1016/j.enpol.2025.114654
- Lyon, T. P. 2016. “Drivers and Impacts of Renewable Portfolio Standards. ”Annual Review of Resource Economics8: 141–155. . doi.org/10.1146/annurev-resource-100815-095432
- Marx, S. M. , E. U. Weber, B. S. Orlove, et al. 2007. “Communication and Mental Processes: Experiential and Analytic Processing of Uncertain Climate Information. ”Global Environmental Change, Uncertainty and Climate Change Adaptation and Mitigation17: 47–58. . doi.org/10.1016/j.gloenvcha.2006.10.004
- Marzi, S. , J. Mysiak, A. H. Essenfelder, M. Amadio, S. Giove, andA. Fekete. 2019. “Constructing a Comprehensive Disaster Resilience Index: The Case of Italy. ”PLoS ONE14: e0221585. . doi.org/10.1371/journal.pone.0221585
- Mavhura, E. , T. Manyangadze, andK. R. Aryal. 2021. “A Composite Inherent Resilience Index for Zimbabwe: An Adaptation of the Disaster Resilience of Place Model. ”International Journal of Disaster Risk Reduction57: 102152. . doi.org/10.1016/j.ijdrr.2021.102152
- McDermott, T. K. J. , F. Barry, andR. S. J. Tol. 2014. “Disasters and Development: Natural Disasters, Credit Constraints, and Economic Growth. ”Oxford Economic Papers66: 750–773. . doi.org/10.1093/oep/gpt034
- Myers, T. A. , E. W. Maibach, C. Roser‐Renouf, K. Akerlof, andA. A. Leiserowitz. 2013. “The Relationship Between Personal Experience and Belief in the Reality of Global Warming. ”Nature Climate Change3: 343–347. . doi.org/10.1038/nclimate1754
- Nawaz Khan, S. , andS. Ali Abbas Kazmi. 2022. “Integrative Decision‐Making Framework for Techno‐Economic Planning and Sustainability Assessment of Renewable Dominated Standalone Hybrid Microgrids Infrastructure at Provincial Scale of Pakistan. ”Energy Conversion and Management270: 116168. . doi.org/10.1016/j.enconman.2022.116168
- Neil Adger, W. , N. W. Arnell, andE. L. Tompkins. 2005. “Successful Adaptation to Climate Change Across Scales. ”Global Environmental Change15: 77–86. . doi.org/10.1016/j.gloenvcha.2004.12.005
- Neumayer, E. , andF. Barthel. 2011. “Normalizing Economic Loss From Natural Disasters: A Global Analysis. ”Global Environmental Change21: 13–24. . doi.org/10.1016/j.gloenvcha.2010.10.004
- NiklasS. , andF. Mey. 2023. Understanding the concept of community energy resilience and its applications. Institute for Sustainable Futures.
- Nohrstedt, D. , J. Hileman, M. Mazzoleni, G. Di Baldassarre, andC. F. Parker. 2022. “Exploring Disaster Impacts on Adaptation Actions in 549 Cities Worldwide. ”Nature Communications13: 3360. . doi.org/10.1038/s41467-022-31059-z
- Noy, I. 2009. “The Macroeconomic Consequences of Disasters. ”Journal of Development Economics88: 221–231. . doi.org/10.1016/j.jdeveco.2008.02.005
- Ogunbode, C. A. , Y. Liu, andN. Tausch. 2017. “The Moderating Role of Political Affiliation in the Link Between Flooding Experience and Preparedness to Reduce Energy Use. ”Climatic Change145: 445–458. . doi.org/10.1007/s10584-017-2089-7
- Oh, C. H. , andJ. Oetzel. 2011. “Multinationals' Response to Major Disasters: How Does Subsidiary Investment Vary in Response to the Type of Disaster and the Quality of Country Governance?”Strategic Management Journal32: 658–681. . doi.org/10.1002/smj.904
- Okolo, C. V. , andJ. Wen. 2022. “Economics of Natural Disasters and Technological Innovations in Africa: An Empirical Evidence. ”Environmental Science and Pollution Research30: 12362–12384. . doi.org/10.1007/s11356-022-22989-8
- Onuma, H. , K. J. Shin, andS. Managi. 2017. “Household Preparedness for Natural Disasters: Impact of Disaster Experience and Implications for Future Disaster Risks in Japan. ”International Journal of Disaster Risk Reduction21: 148–158. . doi.org/10.1016/j.ijdrr.2016.11.004
- Food and Agriculture Organization. 2019. The State of Food Security and Nutrition in the World 2019: Safeguarding against Economic Slowdowns and Downturns. 1st ed. The State of Food Security and Nutrition in the World Series. United Nations Publications.
- Panteli, M. , andP. Mancarella. 2015a. “The Grid: Stronger, Bigger, Smarter?: Presenting a Conceptual Framework of Power System Resilience. ”IEEE Power and Energy Magazine13: 58–66.
- Panteli, M. , andP. Mancarella. 2015b. “Influence of Extreme Weather and Climate Change on the Resilience of Power Systems: Impacts and Possible Mitigation Strategies. ”Electric Power Systems Research127: 259–270. . doi.org/10.1016/j.epsr.2015.06.012
- Pappis, I. , C. Centurion, E. P. Ramos, et al. 2021. “Implications to the Electricity System of Paraguay of Different Demand Scenarios and Export Prices to Brazil. ”Energy Systems12: 911–939. . doi.org/10.1007/s12667-020-00420-w
- Park, B. , andJ. Hur. 2018. “Spatial Prediction of Renewable Energy Resources for Reinforcing and Expanding Power Grids. ”Energy164: 757–772. . doi.org/10.1016/j.energy.2018.09.032
- Polzin, F. , F. Egli, B. Steffen, andT. S. Schmidt. 2019. “How Do Policies Mobilize Private Finance for Renewable Energy?—A Systematic Review With an Investor Perspective. ”Applied Energy236: 1249–1268. . doi.org/10.1016/j.apenergy.2018.11.098
- Porter, J. J. , D. Demeritt, andS. Dessai. 2015. “The Right Stuff? Informing Adaptation to Climate Change in British Local Government. ”Global Environmental Change35: 411–422. . doi.org/10.1016/j.gloenvcha.2015.10.004
- Prontera, A. 2021. “The Dismantling of Renewable Energy Policy in Italy. ”Environmental Politics30: 1196–1216. . doi.org/10.1080/09644016.2020.1868837
- Rahman, M. H. 2018. “Earthquakes Don't Kill, Built Environment Does: Evidence From Cross‐Country Data. ”Economic Modelling70: 458–468. . doi.org/10.1016/j.econmod.2017.08.027
- Reckien, D. , M. Salvia, O. Heidrich, et al. 2018. “How Are Cities Planning to Respond to Climate Change? Assessment of Local Climate Plans From 885 Cities in the EU‐28. ”Journal of Cleaner Production191: 207–219. . doi.org/10.1016/j.jclepro.2018.03.220
- Rissman, J. , C. Bataille, E. Masanet, et al. 2020. “Technologies and Policies to Decarbonize Global Industry: Review and Assessment of Mitigation Drivers Through 2070. ”Applied Energy266: 114848. . doi.org/10.1016/j.apenergy.2020.114848
- Roege, P. E. , Z. A. Collier, J. Mancillas, J. A. McDonagh, andI. Linkov. 2014. “Metrics for Energy Resilience. ”Energy Policy72: 249–256. . doi.org/10.1016/j.enpol.2014.04.012
- Rose, A. 2004. “Defining and Measuring Economic Resilience to Disasters. ”Disaster Prevention and Management: An International Journal13: 307–314. . doi.org/10.1108/09653560410556528
- Rose, A. 2007. “Economic Resilience to Natural and Man‐Made Disasters: Multidisciplinary Origins and Contextual Dimensions. ”Environmental Hazards7: 383–398. . doi.org/10.1016/j.envhaz.2007.10.001
- Rose, A. 2017. Benefit‐Cost Analysis of Economic Resilience Actions. Oxford University Press. . doi.org/10.1093/acrefore/9780199389407.013.69
- Sadorsky, P. 2009. “Renewable Energy Consumption and Income in Emerging Economies. ”Energy Policy37: 4021–4028. . doi.org/10.1016/j.enpol.2009.05.003
- Saja, A. M. A. , M. Teo, A. Goonetilleke, andA. M. Ziyath. 2018. “An Inclusive and Adaptive Framework for Measuring Social Resilience to Disasters. ”International Journal of Disaster Risk Reduction28: 862–873. . doi.org/10.1016/j.ijdrr.2018.02.004
- Sequeira, T. N. , andM. S. Santos. 2018. “Renewable Energy and Politics: A Systematic Review and New Evidence. ”Journal of Cleaner Production192: 553–568. . doi.org/10.1016/j.jclepro.2018.04.190
- Shahbaz, M. , A. Sinha, C. Raghutla, andX. V. Vo. 2022. “Decomposing Scale and Technique Effects of Financial Development and Foreign Direct Investment on Renewable Energy Consumption. ”Energy238: 121758. . doi.org/10.1016/j.energy.2021.121758
- Shao, W. , andF. Hao. 2024. “Understanding the Relationships Among Experience With Extreme Weather Events, Perceptions of Climate Change, Carbon Dependency, and Public Support for Renewable Energies in the United States. ”Energy and Climate Change5: 100139. . doi.org/10.1016/j.egycc.2024.100139
- Sharifi, A. , andY. Yamagata. 2016. “Principles and Criteria for Assessing Urban Energy Resilience: A Literature Review. ”Renewable and Sustainable Energy Reviews60: 1654–1677. . doi.org/10.1016/j.rser.2016.03.028
- Shen, Y. , X. Shi, Z. Zhao, R. Q. Grafton, J. Yu, andY. Shan. 2024. “Quantifying Energy Transition Vulnerability Helps More Just and Inclusive Decarbonization. ”PNAS Nexus3: pgae427. . doi.org/10.1093/pnasnexus/pgae427
- Siegel, E. L. , K. Lane, A. Yuan, et al. 2024. “Energy Insecurity Indicators Associated With Increased Odds of Respiratory, Mental Health, and Cardiovascular Conditions: Study Examines Energy Insecurity and Health Conditions. ”Health Affairs43: 260–268. . doi.org/10.1377/hlthaff.2023.01052
- Skidmore, M. , andH. Toya. 2002. “Do Natural Disasters Promote Long‐Run Growth?”Economic Inquiry40: 664–687. . doi.org/10.1093/ei/40.4.664
- Smit, B. , andO. Pilifosova. 2003. “Adaptation to Climate Change in the Context of Sustainable Development and Equity. ”Sustainable Development8: 9.
- Solecki, W. , N. Grimm, P. Marcotullio, et al. 2019. “Extreme Events and Climate Adaptation‐Mitigation Linkages: Understanding Low‐Carbon Transitions in the Era of Global Urbanization. ”WIREs Climate Change10: e616. . doi.org/10.1002/wcc.616
- Song, W. , Y. Li, J. Cheng, R. Chen, J. Wu, andN. Jia. 2024. “Enhancing Social Vulnerability Assessment With Energy Resilience: A Comprehensive Study of the Netherlands. ”Sustainable Cities and Society103: 105251. . doi.org/10.1016/j.scs.2024.105251
- Song, Y. , C. Wang, andZ. Wang. 2023. “Climate Risk, Institutional Quality, and Total Factor Productivity. ”Technological Forecasting and Social Change189: 122365.
- Spence, A. , W. Poortinga, C. Butler, andN. F. Pidgeon. 2011. “Perceptions of Climate Change and Willingness to Save Energy Related to Flood Experience. ”Nature Climate Change1: 46–49. . doi.org/10.1038/nclimate1059
- Spence, R. 2004. “Risk and Regulation: Can Improved Government Action Reduce the Impacts of Natural Disasters?”Building Research & Information32: 391–402. . doi.org/10.1080/0961321042000221043
- Stirling, A. 2010. “Multicriteria Diversity Analysis: A Novel Heuristic Framework for Appraising Energy Portfolios. ”Energy Policy, Energy Security—Concepts and Indicators with Regular Papers38: 1622–1634. . doi.org/10.1016/j.enpol.2009.02.023
- Taghizadeh‐Hesary, F. , T. Sarker, N. Yoshino, A. Mortha, andX. V. Vo. 2021. “Quality Infrastructure and Natural Disaster Resiliency: A Panel Analysis of Asia and the Pacific. ”Economic Analysis and Policy69: 394–406. . doi.org/10.1016/j.eap.2020.12.021
- Tan, H. , N. Iqbal, andZ. Wu. 2022. “Evaluating the Impact of Stakeholder Engagement for Renewable Energy Sources and Economic Growth for CO2Emission. ”Renewable Energy198: 999–1007. . doi.org/10.1016/j.renene.2022.08.039
- Thirunavukkarasu, M. , Y. Sawle, andH. Lala. 2023. “A Comprehensive Review on Optimization of Hybrid Renewable Energy Systems Using Various Optimization Techniques. ”Renewable and Sustainable Energy Reviews176: 113192.
- Toya, H. , andM. Skidmore. 2007. “Economic Development and the Impacts of Natural Disasters. ”Economics Letters94: 20–25. . doi.org/10.1016/j.econlet.2006.06.020
- UNDP. 2024. Human Development Index. UNDP.
- UNDRR. 2017. Technical Guidance for Monitoring and Reporting on Progress in Achieving the Global Targets of the Sendai Framework for Disaster Risk Reduction. UNDRR.
- UNDRR. 2019. Global Assessment Report on Disaster Risk Reduction (GAR). UNDRR.
- UNISDR. 2015. Sendai Framework for Disaster Risk Reduction 2015–2030. UNISDR.
- Uzar, U. 2020. “Political Economy of Renewable Energy: Does Institutional Quality Make a Difference in Renewable Energy Consumption?”Renewable Energy155: 591–603. . doi.org/10.1016/j.renene.2020.03.172
- Van Der Wiel, K. , H. C. Bloomfield, R. W. Lee, et al. 2019. “The Influence of Weather Regimes on European Renewable Energy Production and Demand. ”Environmental Research Letters14: 94010. . doi.org/10.1088/1748-9326/ab38d3
- Van Loon, A. F. , S. Kchouk, A. Matanó, et al. 2024. “Review Article: Drought as a Continuum—Memory Effects in Interlinked Hydrological, Ecological, and Social Systems. ”Natural Hazards and Earth System Sciences24: 3173–3205. . doi.org/10.5194/nhess-24-3173-2024
- Wang, B. , R. ‐Y. Ke, X. ‐C. Yuan, andY. ‐M. Wei. 2014. “China's Regional Assessment of Renewable Energy Vulnerability to Climate Change. ”Renewable and Sustainable Energy Reviews40: 185–195. . doi.org/10.1016/j.rser.2014.07.154
- Wang, Y. , D. Wang, L. Yu, andJ. Mao. 2023. “What Really Influences the Development of Renewable Energy? A Systematic Review and Meta‐Analysis. ”Environmental Science and Pollution Research International30: 62213–62236. . doi.org/10.1007/s11356-023-26286-w
- Wang, Z. , C. Y, B. Zhang, Z. Ahmed, andM. Ahmad. 2023. “Environmental Degradation, Renewable Energy, and Economic Growth Nexus: Assessing the Role of Financial and Political Risks?”Journal of Environmental Management325: 116678. . doi.org/10.1016/j.jenvman.2022.116678
- Ward, P. S. , andG. E. Shively. 2017. “Disaster Risk, Social Vulnerability, and Economic Development. ”Disasters41: 324–351. . doi.org/10.1111/disa.12199
- Way, R. , M. C. Ives, P. Mealy, andJ. D. Farmer. 2022. “Empirically Grounded Technology Forecasts and the Energy Transition. ”Joule6: 2057–2082. . doi.org/10.1016/j.joule.2022.08.009
- Williams, C. , A. Fenton, andS. Huq. 2015. “Knowledge and Adaptive Capacity. ”Nature Climate Change5: 82–83. . doi.org/10.1038/nclimate2476
- World Bank Group. 2024. RISE. World Bank Group.
- World Bank. 2024. World Development Indicators. World Bank.
- Xu, L. , K. Feng, N. Lin, et al. 2024. “Resilience of Renewable Power Systems Under Climate Risks. ”Nature Reviews Electrical Engineering1: 53–66. . doi.org/10.1038/s44287-023-00003-8
- Yeganeh, A. J. , A. P. McCoy, andT. Schenk. 2020. “Determinants of Climate Change Policy Adoption: A Meta‐Analysis. ”Urban Climate31: 100547. . doi.org/10.1016/j.uclim.2019.100547
- Zaman, K. , M. M. Khan, M. Ahmad, andR. Rustam. 2012. “Determinants of Electricity Consumption Function in Pakistan: Old Wine in a New Bottle. ”Energy Policy50: 623–634. . doi.org/10.1016/j.enpol.2012.08.003
- Zhang, M. , S. Zhang, C. ‐C. Lee, andD. Zhou. 2021. “Effects of Trade Openness on Renewable Energy Consumption in OECD Countries: New Insights From Panel Smooth Transition Regression Modelling. ”Energy Economics104: 105649. . doi.org/10.1016/j.eneco.2021.105649
- Zhao, S. , K. Li, M. Yin, J. Yu, Z. Yang, andY. Li. 2024. “Transportable Energy Storage Assisted Post‐Disaster Restoration of Distribution Networks With Renewable Generations. ”Energy295: 131105. . doi.org/10.1016/j.energy.2024.131105
Republished from the open web under CC-BY. Authors: Hong J, Chen Y, Yi W, Chi HL. Read the original.