Investigating Thermotolerance of Thylakoid Processes in Two Cotton Species using Rapid Induction Fluorescence.
High temperatures can hinder stand establishment, seedling growth, and photosynthetic processes in cotton. Yet, interpretations of thermotolerance in thylakoid processes often depend on whether measurements follow chronic or acute heat exposure, and species-level differences in these responses remain poorly characterized. This study evaluated the effects of chronic high temperatures (40°C/30°C) on key thylakoid processes in four-week-old Upland and Pima cotton seedlings and assessed their acclimation potential using rapid induction chlorophyll fluorescence across a range of incubation temperatures. As these processes were inferred from OJIP parameters rather than direct measurements of photosystem activity, they are interpreted as fluorescence-based indicators of thylakoid function. Chronic heat enhanced photosystem I (PSI)-related parameters in both species, with Upland exhibiting larger increases (44%-46%) compared to Pima (39%-40%), whereas photosystem II (PSII) photochemistry remained largely stable under chronic heat, declining by less than 2% at 40°C and by 6%-8% at 45°C under acute exposure. Acute temperature responses closely mirrored chronic patterns, and Upland showed higher thermal optima for PSI quantum yield and overall performance (40°C) than Pima (35°C), suggesting greater PSI electron-sink capacity. Collectively, these fluorescence-derived results suggest that PSI-related processes distinguish species-level thermotolerance in cotton. Upland's stronger enhancement of PSI acceptor-side capacity under both sustained and transient heat exposure points to a more robust acclimation strategy, whereas Pima shows limited PSI adjustment despite maintaining PSII efficiency. These findings clarify how thylakoid processes respond to heat across timescales and may help guide the development of heat-resilient cotton as growing-season temperatures rise.
Introduction
Cotton (Gossypium spp) is globally significant, especially in the apparel, animal feed, and food industries (Liu et al.2012; OECD/FAO2023). Cotton production contributes to the economic growth of many countries, including the United States (USDA‐ERS2022). High seedling vigor is important in cotton production to ensure stand establishment and reduce susceptibility to early‐season pests (Snider and Oosterhuis2015; Raphael et al.2017; Hand et al.2021; Liu et al.2015). Hence, temperature extremes or other stressors considered unsuitable for key processes and growth stages may significantly penalize stand establishment and increase the risk of crop loss (Snider et al.2021). While low temperatures during the early spring months are the most common limitation to seedling growth, potentially growth‐limiting high temperatures are not uncommon in the weeks that follow planting in the southeastern US (Virk et al.2021).
It is well established that reproductive development in cotton is sensitive to high‐temperature extremes (Reddy, Hodges, and Reddy1992; Reddy et al.1997; Snider and Oosterhuis2011; Snider et al.2009; Luqman et al.2025); however, detrimental effects of heat stress on early‐season growth and photosynthetic processes have also been observed (Reddy et al.2017; Virk et al.2021; Raphael et al.2017; Kaur, Snider, Parkash, et al.2023; Parkash et al.2024). High temperatures above 35°C limited leaf area development, height, and total shoot dry weight of cotton seedlings (Virk et al.2021), whereas in other studies, temperatures above 30°C were sufficient to cause significant declines in biomass accumulation (Reddy et al.1991; Kaur, Snider, Parkash, et al.2023). Although genotypic differences in seedling growth response to high temperature have been observed for cotton, a 40°C/30°C temperature regime consistently caused reductions in leaf area and total dry weight, irrespective of cultivar (Kaur, Snider, Parkash, et al.2023). Similarly, declines in photosynthesis under acute high temperature stress (35°C to 40°C) have been well documented (Crafts‐Brandner and Salvucci2000; Law and Crafts‐Brandner1999). Heat‐induced limitations to photosynthesis have been attributed to different factors, ranging from limitations to electron transport and RuBP regeneration to the inactivity of rubisco (Wise et al.2004; Scafaro et al.2023; Schrader et al.2004; Crafts‐Brandner and Law2000), and potentially even declines in photosynthetic pigments (Thompson et al.2022; Snider et al.2009; Snider, Oosterhuis, and Kawakami2010; Parkash et al.2024). High temperatures also promote reactive oxygen species accumulation, and cotton genotypes differ in their capacity to maintain oxidative homeostasis and overall thermotolerance (Luqman et al.2025; Khan et al.2026).
Chlorophyll fluorescence has been widely utilized to identify functional limitations to photosynthesis under a wide range of conditions (Maxwell and Johnson2000). Measurements that characterize the polyphasic rise in chlorophyll fluorescence of dark‐adapted leaves are often termed “OJIP” assays after the different steps measured in the fluorescence transient (Strasser et al.2000; Strasser et al.2010). Specifically, parameters measured under dark‐adapted conditions using OJIP fluorescence (Strasser et al.2000) include structural indicators, performance indices, and quantum efficiencies of the photosynthetic apparatus under abiotic stress (Kaur, Snider, Paterson, et al.2023; Virk et al.2021; Snider et al.2018; Strasser et al.2010; Strauss et al.2006). For cotton plants subjected to long‐term heat stress, PSII antenna size and reaction center‐specific fluxes (ABS/RC, TR0/RC, and DI0/RC) did not differ from plants grown under optimal temperature regimes (Virk et al.2021). In contrast, the relative abundance of PSI with respect to PSII (ΔVIP) increased by 8% when the temperature increased from 30°C to 35°C and 40°C. This is in contrast with declines in ΔVIPobserved in the literature for other forms of abiotic stress (Ceppi et al.2012; Oukarroum et al.2009). Performance indices and quantum efficiencies of various steps in the thylakoid reactions were influenced by chronic heat stress. The fluorescence index representing the contribution of the light‐dependent reactions to primary photochemistry (Fv/F0) and the photosynthetic performance index (PIABS) declined by 13% and 22%, respectively, when growth temperature increased from 35°C to 40°C (Virk et al.2021). In the same study, the quantum efficiency of energy trapping (ΦPo), and intersystem electron transport (ΦEo) declined at 40°C by 4% and 12%, respectively. In comparison, the total performance index (PITOTAL) and the quantum efficiency of PSI electron acceptor reduction (ΦRo) were not influenced by temperature increases up to 40°C (Virk et al.2021).
Importantly, heat tolerance can differ drastically depending on the thylakoid process evaluated (Virk et al.2021; Law and Crafts‐Brandner1999; Kaur, Snider, Parkash, et al.2023; Parkash et al.2024; Snider et al.2015). For example, the maximum quantum yield of energy trapping by photosystem II (Fv/Fmor ϕP0) has been generally considered stable under heat stress well above 40°C (Law and Crafts‐Brandner1999; Kaur, Snider, Parkash, et al.2023; Snider, Oosterhuis, and Kawakami2010; Snider et al.2013), while other quantum efficiencies, structural indicators, and performance indices exhibit greater heat sensitivity (Virk et al.2021; Hu et al.2018). However, interpretations of high‐temperature effects and thermotolerance of thylakoid processes could depend on whether measurements are done following chronic or acute high‐temperature exposure (Bibi et al.2008; Sarwar et al.2023; Kaur, Snider, Paterson, et al.2023; Kaur, Snider, Parkash, et al.2023; Virk et al.2021; Sethar et al.2002). This is because the growth environment could alter the thermotolerance of thylakoid processes through acclimation (Kaur, Snider, Parkash, et al.2023; Kaur, Snider, Paterson, et al.2023; Snider et al.2013).
Rapid temperature response curves have been employed to estimate the thermotolerance of thylakoid processes by exposing dark‐adapted leaves to increasing incubation temperatures and calculating temperature thresholds causing a 15% decline (T15) in each process (Chastain et al.2016; Froux et al.2004; Kaur, Snider, Parkash, et al.2023; Hu et al.2018; Snider et al.2015). For instance, Snider et al. (2015) noted that the lowest T15value for ΦPοwas 45.2°C during a relatively mild growing season. However, corresponding T15values for variable fluorescence (Fv/F0), the quantum yield of intersystem electron transport (ΦEo), and the quantum yield of photosystem I electron acceptor reduction (REο/ABS or ΦRο) were 34.1°C, 37.6°C, and 42.0°C, respectively. Similarly, using the same approach, Hu et al. (2018) showed that the quantum efficiency of energy trapping by PSII and electron acceptor reduction by PSI (ΦRoand ΦPo) were more heat‐tolerant than the quantum efficiency of inter‐photosystem electron transport (ΦEo) or photosynthetic performance indices that were dependent on electron transport (PITOTALand PIABS). The authors also documented upward shifts in T15across nearly every process in plants grown under optimal day/night temperatures (30°C/20°C) compared with those grown under suboptimal temperatures (20°C/15°C).
Cotton cultivars have been shown to differ in heat tolerance of thylakoid processes (Kaur, Snider, Parkash, et al.2023; Hejnák et al.2015; Kaur, Snider, Paterson, et al.2023; Virk et al.2021). Furthermore, as thylakoid processes can exhibit heat acclimation (Kaur, Snider, Parkash, et al.2023; Froux et al.2004), cotton cultivars have shown significant differences in seedling heat tolerance and acclimation potential of PSII (Kaur, Snider, Paterson, et al.2023; Kaur, Snider, Parkash, et al.2023; Virk et al.2021; Adegbenro et al.2025). Another study comparing photosynthetic thermotolerance and growth responses of Upland (Gossypium hirsutum) and Pima (Gossypium barbadense) cultivars showed that the Pima cultivar was the most heat‐sensitive for early‐season growth and ΦPo, whereas it was more heat‐tolerant for ΦEoand ΦRothan other tested Upland cultivars (Kaur, Snider, Parkash, et al.2023). Despite the strength of this study, photosynthetic thermotolerance was addressed for only three thylakoid responses (ΦPo, ΦEoand ΦRo) using rapid temperature response curves (Kaur, Snider, Parkash, et al.2023), and no attempt was made to distinguish between chronic and acute heat stress effects on OJIP‐derived parameters. Upland and Pima cotton are the first and second most widely grown species of cotton in the world (Unruh and Silvertooth1996; Holladay et al.2021). Within the US, Pima is primarily grown in the hot, arid southwest, whereas Upland is grown across a much broader range of environments that encompasses the entire southern half of the country (Unruh and Silvertooth1996). As a result, it was hypothesized in the current study that (1) the two species would exhibit significant differences in thylakoid responses to chronically high growth temperature and (2) these species‐specific differences in thylakoid responses would be explained by differences in the acclimation potential of the two species. Hence, the objectives of this study were: (1) to assess the effect of chronic high temperature exposure on key thylakoid processes in seedlings of two cotton species, and (2) to assess the acclimation potential of thylakoid processes using rapid temperature response curves.
Materials and Methods
Growth Conditions and Treatments
This study was conducted in two walk‐in growth chambers at the Georgia Envirotron facility, University of Georgia, Griffin, GA. Two different temperature regimes were used: (1) 30°C during the day and 20°C at night (optimal temperature) and (2) 40°C during the day and 30°C at night (high temperature) (Kaur, Snider, Parkash, et al.2023; Virk et al.2021; Burke and Wanjura2010). Two cotton species were studied: (1) Upland (G. hirsutum) and (2) Pima (G. barbadense) (Table1). The Upland cultivar Deltapine 1646 B2XF and the Pima cultivar Deltapine 341 RF were used, and both were among the top commercially available upland and Pima cultivars commercially produced in the United States at the time of this experiment (Hutmacher2021; USDA‐AMS2020; Hand et al.2023).
Table: Experimental design and treatment structure for each cotton species, showing growth‐temperature treatments, plant developmental stage at the time of measurement, and the leaf position measured at each point of chlorophyll fluorescence measurement.
All environmental conditions, except for temperature, were kept consistent across both growth chambers. Photosynthetically active radiation was maintained at an intensity of 800 μmol m−2s−1during the day, with a photoperiod of 14 h of light and 10 h of darkness. This is a similar photoperiod to what is normally experienced by the cotton crop in the early season in Georgia. The plants were grown under the specified temperature regimes for four weeks following planting, before floral initiation. This study was conducted in two separate experimental runs. To minimize potential chamber effects, growth‐temperature regimes were reassigned to different growth chambers between the two experimental runs, so that no regime remained in the same chamber across runs. In each experimental run, there were 10 pots of each cotton species randomized in each growth chamber to fulfill various study objectives. Specifically, five pots were used for survey measures of dark‐adapted, predawn chlorophyll fluorescence, and five pots were used for fluorescence‐incubation temperature experiments.
Plants were grown in 8‐l pots filled with a nursery growing media (PRO‐MIX BX, Premier Tech Growers, and Consumers, Quakertown, PA). Three seeds were planted per pot, and after seedling emergence, two plants were removed to maintain one healthy plant per pot. All plants were well‐watered by irrigating to full pot capacity daily throughout the experiment, ensuring that water availability did not limit growth. Starting one week after planting, the plants were fertilized twice weekly with a water‐soluble complete fertilizer (P.F.I. 20–20‐20 Multi‐Purpose Water Soluble Fertilizer, Plant Foods). Specifically, each pot was fertilized with 50 mL of a 0.8% w/v solution of the water‐soluble fertilizer.
Chlorophyll Fluorescence Assessments at Growth Temperature
At the end of the four‐week period, chlorophyll fluorescence measurements were conducted on five plants from each cotton species in each growth chamber during both experimental runs. These measurements were performed on uppermost, fully‐expanded, mainstem leaves using a portable photosynthesis system equipped with an integrated leaf chamber fluorometer (LI‐6800, Li‐COR Biosciences, Lincoln, NE, USA). Dark‐adapted chlorophyll fluorescence measurements were taken during pre‐dawn hours (between 0400 and 0600 h). This was done to ensure that plants were dark‐adapted for as long as is realistically possible in a natural setting. However, the temperature of the growth chamber was then adjusted to the daytime setting, and the plants were incubated for 20 min prior to obtaining dark‐adapted measurements. This approach ensured that measurements were done at the highest temperature for both treatments. For the dark‐adapted assessments, all environmental conditions within the leaf chamber were kept consistent across treatments, except for air temperature. Specifically, the photosynthetically active radiation (PAR) intensity was maintained at 0 μmol m2s−1, the reference CO2concentration was set at 400 μmol mol−1, relative humidity was maintained at 60% ± 10%, and the air temperature of the leaf chamber was adjusted according to the growth temperature treatment.
Chlorophyll fluorescence was assessed over a 6 cm2leaf area using an induction flash to generate chlorophyll transient curves. With the exposure of the photosynthetic sample to a saturating flash of light, fluorescence intensity changes from the intensity observed in the ground state (F0) to maximum fluorescence intensity (Fm). From this induction curve, intensities of fluorescence at the start of the measurement (O step; F0), inflection point (J step; 2 milliseconds), intermediary peak (I step; 20 milliseconds), peak (P step; Fm), and initial slope of the curve are recorded (Strasser and Govindjee1992). Based on the theory of energy fluxes in biomembranes, it is said that the different steps and phases of induction curves are associated with the redox states of photosystem II, the efficiency of electron transfer beyond QA, and electron transfer to electron acceptors by photosystem I (Strasser et al.2010). From the recorded fluorescence intensities at O, J, I, and P steps and the initial slope, a number of parameters describing the structural and functional state of the photosynthetic apparatus were derived using formulas provided in the available literature (Strasser et al.2010; Strauss et al.2006). Structural and energy flux‐related parameters: (1) RC/CS0: density of reaction centers (RC) of PSII within the excited cross section (CS0), (2) ABS/RC: absorption flux per RC (effective antenna size of active reaction centers of PSII), (3) TR0/RC: energy flux contributing to reduction of QAper RC, (4) ET0/RC: electron flux driving reduction of electron acceptors located past QAin the electron transport chain, (5) REo/RC: electron flux driving reduction of electron acceptors by PSI, (6) DI0/RC: dissipation energy flux per RC, and (7) ΔVIP: indicator of relative abundance of PSI with respect to PSII. Quantum efficiency related parameters: (1) ΦPo: maximum quantum yield of primary photochemistry of PSII of a dark‐adapted leaf, (2) ΦEo: quantum yield of electron transport to electron acceptors beyond QA, and (3) ΦRo: quantum yield of electron transport to electron acceptors at the PSI acceptor side.
Performance indices included: (1) PIABS: this performance index represents the energy conservation from photons absorbed by the PSII antenna to the reduction of electron acceptors present beyond QAin the electron transport chain; (2) PITOTAL: this performance index represents energy conservation from photons absorbed by PSII antenna to the reduction of electron acceptors at the PSI acceptor side, and (3) Fv/F0: this represents the contribution of light‐dependent reactions to primary photochemistry (Strasser et al.2010; Strauss et al.2006).
The complete datasets showing chlorophyll fluorescence responses to growth temperature and cotton species are provided as DataS1in the supporting information, with variable definitions described in the accompanying README (seeFile S1).
Response of Chlorophyll Fluorescence Parameters to Incubation Temperature
To generate rapid temperature response curves for each experimental unit, at the conclusion of the four‐week period, the response of dark‐adapted chlorophyll fluorescence to increasing incubation temperature (30°C, 35°C, 40°C, and 45°C) was assessed. Five plants from each species from each growth temperature were transferred to a growth chamber maintained at 30°C. All other environmental conditions in this chamber were kept consistent with those in the growth chambers used for the temperature treatments. The fluorometer settings and environmental conditions within the LI‐6800 leaf chamber were aligned with those used for the previous dark‐adapted chlorophyll fluorescence measurements. The air temperature of the leaf chamber was adjusted to match that of the growth chamber during the measurements. Following initial measurements at 30°C, the temperature of the growth chamber and the leaf chamber on the LI‐6800 were increased to the next target incubation temperature. Approximately 15 min was required for chamber temperature to reach the target temperature, and once the target temperature was reached, plants were incubated for another 5 min at each temperature prior to conducting OJIP fluorescence measurements. Because measurements were made with the LI‐6800 rather than a conventional fast‐fluorescence instrument, gas‐exchange and fluorescence data were logged only once net photosynthetic rate had reached steady state (~2 min). Fluorescence data at each temperature were logged only after leaf temperature and net photosynthesis had stabilized, confirming physiological equilibration prior to measurement. Furthermore, short incubation periods of this kind (5 min) are consistent with established fluorescence‐temperature response protocols for cotton and other species, in which incubation times of less than or equal to 6 min yield stable temperature‐response curves (Epron1997; Ladjal et al.2000; Kaur, Snider, Paterson, et al.2023; Snider, Oosterhuis, and Kawakami2010; Snider, Choinski, and Slaton2010; Hu et al.2018). The parameters recorded at each incubation temperature included fluorescence intensities at the O, J, I, and P steps, as well as the initial slope of the induction curve, as described above. ΦPo, ΦEo, ΦRo, Fv/F0, PIABS, and PITOTALat each incubation temperature were calculated from the recorded data. All measurements were performed on uppermost, fully‐expanded, mainstem leaves (fourth node below the terminal) at each incubation temperature.
The complete incubation temperature response datasets are provided as DataS2in the supporting information. Variables are described in the accompanying README document (seeFile S1).
Statistical Analysis
All statistical analyses were performed using JMP Pro 18 (SAS Institute Inc., Cary, NC, USA), and figures were prepared using SigmaPlot 16.0 (Systat Software Inc.).
Objective 1
The study was conducted over two experimental runs, with each run treated as a block. During both runs, growth temperature treatments were randomly assigned to different growth chambers. Within each chamber, two cotton species were nested, with five pots allocated for each species. Each pot was considered a replicate, resulting in ten replications for each cotton species at each growth temperature across both experimental runs. To assess the effects of growth temperature, cotton species, and their interactions on the parameters of interest, a mixed‐effects analysis of variance (ANOVA) was performed. In this analysis, growth temperature (GT), cotton species (CS), and the interaction between GT and CS were treated as fixed effects. Experimental run × replication and experimental run × replication × growth temperature were considered random effects. Treatment means were separated using Fisher's protected LSD test at a significance level of 0.05. Significant interaction effects between growth temperature and cotton species were observed for most parameters where any significant effect was observed; thus, the results of these interactions are the primary focus of this report.
Objective 2
To evaluate the effects of growth temperature (GT), cotton species (CS), incubation temperature (IT), and their interactions, a mixed‐effects ANOVA with repeated measures was employed. In this model, GT, CS, IT, GT × CS, GT × IT, CS × IT, and GT × CS × IT were considered fixed effects. Replication within experimental run × growth temperature × cotton species was treated as a subject, while incubation temperature served as a within‐subjects factor. Experimental run × replication and growth temperature × experimental run × replication were treated as random effects. For post hoc analysis, Fisher's protected LSD test was applied at a significance level of 0.05.
Results
Temperature and Cotton Species Effects on Structural Indicators
The density of reaction centers (RC) of PSII within the excited cross section (CS0) of a leaf (RC/CS0), absorbed energy flux per RC (ABS/RC), energy flux contributing to the reduction of QAper RC (TR0/RC), and dissipation energy flux per RC (DI0/RC) were not affected by the growth temperature, cotton species, or their interactions (Table2; full statistical output is provided in TableS1). In contrast, electron flux to electron acceptors beyond QAper RC (ETo/RC) was significantly impacted by the growth temperature only (Table2). ETo/RC was positively affected by high growth temperature, where plants grown in 40°C/30°C (1.38) increased specific flux by 11% relative to plants grown in 30°C/20°C (1.24). Electron flux per RC contributing to reductions of PSI end electron acceptors (REo/RC) was significantly affected by growth temperature, cotton species, and their interaction (Table2). REo/RC increased from 0.59 in 30°C/20°C to 0.92 in 40°C/30°C for Upland and from 0.58 in 30°C/20°C to 0.81 in 40°C/30°C for Pima. REo/RC was statistically comparable between the two species at 30°C/20°C, whereas at 40°C/30°C, Upland had a significantly higher REo/RC than Pima. Similarly, the relative abundance of PSI with respect to PSII (ΔVIP) was significantly affected by growth temperature, cotton species, and their interaction. High temperature exerted a positive impact on ΔVIP, and it increased from 0.27 in the 30°C/20°C regime to 0.39 in the 40°C/30°C regime for Upland and from 0.26 at 30°C/20°C to 0.36 at 40°C/30°C for Pima. Regarding species comparisons, Upland exhibited higher ΔVIPthan Pima only under high‐temperature conditions.
Table: Effect of growth temperature and cotton species on the density of PSII reaction centers (RC/CSo), absorbed energy flux per RC (ABS/RC), flux of excitation energy trapped by a reaction center (TRo/RC), electron flux per RC to electron acceptors beyond QA(ETo/RC), electron flux per RC to PSI end electron acceptors (REo/RC), dissipation energy flux per RC (DIo/RC), indicator of the size of pool of the final electron acceptors of PSI (ΔVIP), maximum quantum yield of primary photochemistry (ΦPo), quantum yield of inter‐photosystem electron transfer (ΦEo), and quantum yield of reduction of PSI end electron acceptors (ΦRo), performance index representing contribution of light reactions to primary photochemistry (Fv/F0), photosystem II performance index based on light absorption (PIABS), and performance index representing energy conservation from the absorbed photons to a reduction of PSI end acceptors (PITOTAL).
Temperature and Cotton Species Effects on Quantum Efficiencies
The maximum quantum yield of photosystem II (ΦPo) was not affected by growth temperature, cotton species, or their interaction (Table2). The quantum yield of electron transport to electron acceptors beyond QA(ΦEo) and the quantum yield of electron transport to electron acceptors at the PSI acceptor side (ΦRo) were significantly responsive to growth temperature, cotton species, and their interaction. At 40°C/30°C, ΦEoincreased relative to the optimum temperature (30°C/20°C), but this response was observed only for Upland, increasing by 11%. Regarding species comparison, at 30°C/20°C, Pima (0.47) had higher ΦEothan Upland (0.44), while at 40°C/30°C, ΦEowas comparable between the two species. High temperature had a positive effect on ΦRoin both species, but the effect was greater in Upland cotton than in Pima. In Upland, ΦRoincreased by 45% in 40°C/30°C relative to 30°C/20°C, while in Pima, it increased by 38%.
Temperature and Cotton Species Effects on Performance Indices
Photosynthetic performance index representing the energy conservation from photons absorbed by PSII antenna to reduction of electron acceptors beyond QA(PIABS) was not significantly affected by the growth temperature, cotton species, or their interaction (Table2). In contrast, there was a significant interaction between growth temperature and cotton species for the performance index representing energy conservation from photon absorption by PSII antenna to the reduction of electron acceptors at the PSI acceptor side (PITOTAL; Table2). PITOTALincreased in response to high temperature, and it increased from 1.96 in 30°C/20°C to 4.5 in 40°C/30°C for Upland cotton and from 1.92 in 30°C/20°C to 3.44 in 40°C/30°C for Pima. PITOTALwas comparable between the two species at 30°C/20°C, whereas at 40°C/30°C, Upland maintained a significantly higher PITOTALthan Pima. The contribution of the light‐dependent reactions to primary photochemistry (Fv/F0) was significantly affected only by the interaction between growth temperature and cotton species. In response to high temperatures, Fv/F0declined, but this response was observed only in Pima, with a 6.4% decline relative to the optimum temperature. Furthermore, at 40°C/30°C, Upland (4.41) had a higher Fv/F0than Pima (4.21), while at 30°C/20°C, Fv/F0was comparable between the two species.
Effect of Cotton Species on Incubation Temperature Responses
To better understand the effects of growth temperature and cotton species on the sensitivity of specific thylakoid processes to acute high temperature exposure, only significant interactions with incubation temperature are reported. There were no significant three‐way interactions among incubation temperature, growth temperature, and cotton species for any measured variables. However, there was a significant interaction between genotype and incubation temperature only for ΦRoand for PITOTAL(Table3). Therefore, species‐specific responses to incubation temperature are provided for these two variables only (Figure1).
Table: ANOVA results for incubation temperature (IT), growth temperature (GT), and cotton species (CS) effects on the performance index representing the contribution of light‐dependent reactions to primary photochemistry (Fv/F0), maximum quantum yield of primary photochemistry (ΦPo), quantum yield of inter‐photosystem electron transfer (ΦEo), quantum yield of reduction of PSI end electron acceptors (ΦRo), photosystem II performance index based on light absorption (PIABS), and performance index representing energy conservation from the absorbed photons to a reduction of PSI end acceptors (PITOTAL).
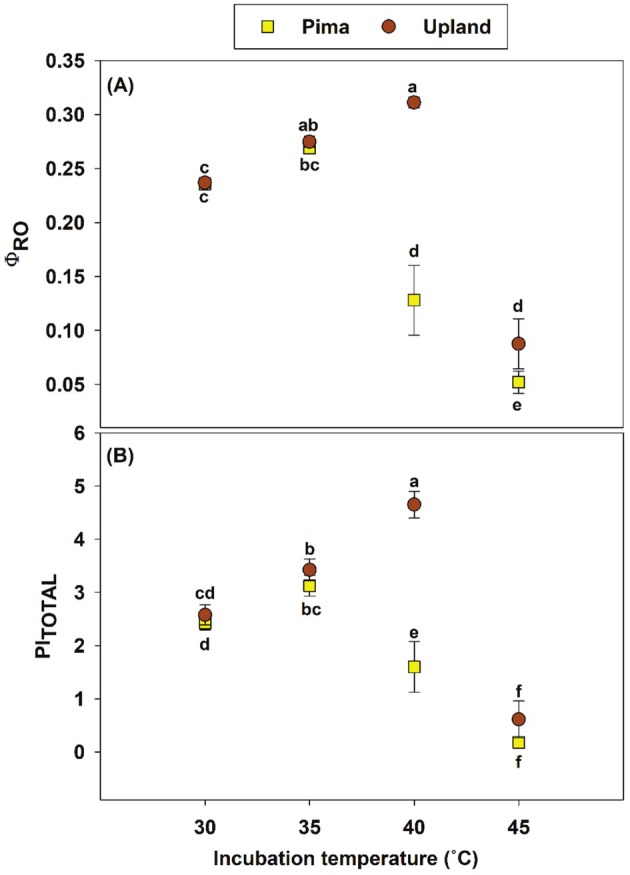
Effect of incubation temperature (30°C, 35°C, 40°C, and 45°C) and cotton species (Pima and Upland) on the quantum yield of reduction of PSI end electron acceptors (ΦRo; A), performance index representing energy conservation from the absorbed photons to a reduction of PSI end acceptors (PITOTAL; B) across two growth temperature regimes (30°C/20°C and 40°C/30°C). Data shown as scatter points represent standard errors; SE (n= 20; 2 runs × 5 replications × 2 growth temperature regimes). Values not sharing a common letter significantly differ (p< 0.05).
ΦRoincreased as incubation temperature rose from 30°C to 35°C for both Upland and Pima cotton, with no significant genotypic differences between the two cotton species at either of these temperatures. ΦRofor Upland and Pima at 35°C increased by approximately 16% and 14%, respectively, relative to 30°C. However, at 40°C, ΦRofor Upland cotton reached its highest value, increasing significantly by 31%, while ΦRo for Pima decreased by 46% compared to 30°C. At the highest incubation temperature (45°C), the lowest ΦRovalues were recorded for both cotton species (Upland = 0.088; Pima = 0.0521), with a significant genotypic difference. Upland cotton at 45°C had a slightly higher ΦRovalue than Pima (Figure1A). A similar temperature response was observed for PITOTAL, with increases of 29% and 33% for Pima and Upland, respectively, as incubation temperature increased from 30°C to 35°C (Figure1B). Furthermore, Upland cotton had its highest PITOTALvalue at 40°C, increasing by 81% relative to 30°C, whereas PITOTALfor Pima declined significantly by 34% at the same incubation temperature. PITOTALfor both cotton species was lowest (Upland = 0.612; Pima = 0.179) at 45°C and was not significantly different from each other.
Therefore, 40°C was the thermal optimum (the incubation temperature yielding the maximum value) for both processes in Upland cotton, yet 35°C was the optimum temperature in Pima cotton. Since there was no interaction between growth temperature and incubation temperature for either process, prior growth temperature did not alter acute high‐temperature responses in either species.
Effect of Prior Growth Temperature on Incubation Temperature Responses
Significant interactive effects of incubation temperature and growth temperature were observed for ΦPo, ΦEo, Fv/F0, and PIABS(Table3). No interactions between cotton species and incubation temperature were observed for these measured parameters. This indicates that prior growth temperature was the dominant factor influencing response to acute high temperature for the previously noted processes.
Cotton plants grown at 30°C/20°C and 40°C/30°C had the highest values of ΦPoat incubation temperatures of 30°C and 35°C (Figure2A). As the incubation temperature increased above 35°C, ΦPodeclined significantly in both growth temperature regimes. Relative to the 30°C incubation temperature, ΦPoat 40°C declined by 1.3% and 1.8% for cotton plants grown under the 30°C/20°C and 40°C/30°C temperature regimes, respectively. A higher reduction was observed as incubation temperature increased to 45°C (30°C/20°C = 8.2% and 40°C/30°C = 5.8%). High‐temperature‐grown plants exhibited a less pronounced decline in ΦPoat 45°C than plants in the optimal temperature regime. Furthermore, at all incubation temperatures, cotton plants grown at the higher temperature regime (40°C/30°C) had higher ΦPovalues than plants grown under the 30°C/20°C regime (Figure2A).
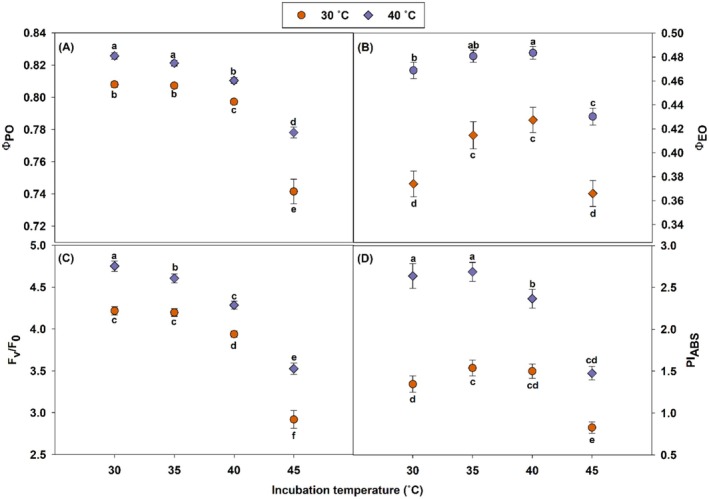
Effect of incubation temperature (30°C, 35°C, 40°C, and 45°C) and growth temperature (30°C/20°C and 40°C/30°C) on the maximum quantum yield of primary photochemistry (ΦPo; A), quantum yield of inter‐photosystem electron transfer (ΦEo; B), performance index representing contribution of light reactions to primary photochemistry (Fv/F0; C), and photosystem II performance index based on light absorption (PIABS; D) for Upland and Pima cotton species. Data shown as scatter points represent means ± standard errors; SE (n= 20; 2 runs × 5 replications × 2 cotton species). Values not sharing a common letter significantly differ (p< 0.05).
ΦEopeaked at 35°C and 40°C incubation temperatures for cotton plants grown under both the 30°C/20°C and 40°C/30°C temperature regimes (Figure2B). Increases in ΦEoof 14% and 3% were observed for optimum and high temperature‐grown plants, respectively, as incubation temperatures increased from 30°C to 40°C. Furthermore, at an incubation temperature of 45°C, ΦEodeclined by 7.6% and 4.6% for the 30°C/20°C and 40°C/30°C growth temperatures, respectively, relative to the average peak values. At all incubation temperatures, higher ΦEo values were recorded for plants grown at 40°C/30°C than at the 30°C/20°C temperature regime (Figure2B).
The temperature response of Fv/F0(Figure2C) was similar to that of ΦPo(Figure2A), with increases in incubation temperature corresponding to decreases in Fv/F0. However, the percent decline in Fv/F0with increasing incubation temperatures was much greater than that of ΦPo. The highest Fv/F0value for plants grown at 40°C/30°C was observed at 30°C and declined at higher incubation temperatures. Meanwhile, Fv/F0for plants grown at 30°C/20°C was highest at the 30°C and 35°C incubation temperatures and declined by 7% and 31% at 40°C and 45°C, respectively (Figure2C). Fv/F0for the 40°C/30°C growth temperature regime declined by 3%, 10%, and 26% at 35°C, 40°C, and 45°C incubation temperatures, respectively, relative to 30°C. Similar to other thylakoid responses above (Figure2A,B), growth temperature significantly influenced Fv/F0, and consistently higher values were noted for the 40°C/30°C plants compared to the 30°C/20°C plants.
PIABSwas significantly influenced by the interaction between incubation temperature and growth temperature (Table3). PIABSfor plants grown at 40°C/30°C peaked at 30°C, remained constant as temperature increased to 35°C, and thereafter declined significantly at higher temperatures (10% at 40°C and 44% at 45°C). Meanwhile, for the 30°C/20°C cotton plants, PIABSincreased by 14% as the incubation temperature increased from 30°C, peaked at 35°C, remained stable at 40°C, and declined by 46% relative to its average peak value at the highest incubation temperature (45°C) (Figure2D). Furthermore, PIABSwas consistently higher for high‐temperature‐grown plants at all incubation temperatures.
Discussion
The frequency and duration of extreme heat waves are expected to increase because of climate change (Jagadish et al.2021). This is a potential limitation to cotton stand establishment and early‐season seedling vigor, especially in the southeastern US, where cotton production is concentrated. Numerous studies have detailed the detrimental effects of heat stress on early‐season vegetative growth, reproductive development, and photosynthetic efficiency of cotton plants, including cultivar sensitivities to heat stress (Kaur, Snider, Parkash, et al.2023; Virk et al.2021; Adegbenro et al.2025; Parkash et al.2024; Reddy, Reddy, and Hodges1992; Reddy et al.2017; Reddy, Hodges, and Reddy1992; Reddy et al.1991). However, a knowledge gap exists in differentiating chronic and acute heat stress responses of specific thylakoid processes for the two most cultivated cotton species. To this end, our study evaluated the rapid and long‐term responses of high temperatures on OJIP‐derived chlorophyll fluorescence parameters in Upland and Pima cotton. By assessing both steady‐state responses to elevated growth temperature and transient responses to rapid thermal stress, we identified key thylakoid processes associated with potential interspecific differences in heat acclimation and stress sensitivity for Upland and Pima cotton (DP 1646 and DP 341, respectively). Because each species was represented by a single commercial cultivar (Hutmacher2021; Hand et al.2023; USDA‐AMS2020), we interpret the species comparisons below at the cultivar level; this is considered further in the limitations.
The first hypothesis of this study was that cotton species would influence thylakoid responses of cotton seedlings under long‐term elevated growth temperatures. Our results support this claim, as some structural and functional OJIP parameters showed significant main and interaction effects of cotton species and growth temperature. In most cases where treatment effects were significant, cotton seedlings grown under the elevated‐temperature regime had higher values for structural indicators, quantum efficiencies, and performance indices. Where the temperature‐by‐genotype interaction was significant, under chronic heat stress, the Upland cotton (DP 1646) consistently exhibited higher acclimation potential than Pima (DP 341) for most parameters except ΦEo. This is evidenced by higher DP 1646 values than DP 341, particularly under high‐temperature conditions. Growth temperature and cotton species did not affect relative antenna size (ABS/RC) or most reaction‐center specific fluxes (RC/CS0, ABS/RC, TR0/RC, and DI0/RC). Similar results were reported by Virk et al. (2021), where no heat stress effects were seen for RC/CS0, ABS/RC, and TR0/RC, suggesting that these processes are relatively insensitive to chronic heat stress in cotton seedlings.
In the current study, long‐term exposure to a 40°C/30°C day/night temperature regime increased PSI‐related parameters. For example, the indicator of the size of the pool of final electron acceptors of PSI (ΔVIP) and the electron flux per reaction center to PSI end acceptors (REo/RC) both increased for Upland and Pima cotton (DP 1646 and DP 341, respectively). Increases in these parameters are generally interpreted as indicators of enhanced PSI acceptor‐side capacity, suggesting that heat stress increased PSI capacity to draw electrons more effectively from the intersystem chain (Strasser et al.2004; Oukarroum et al.2009; Ceppi et al.2012). DP 1646 showed a greater increase than DP 341 for both parameters (ΔVIP: 44.4% in DP 1646 vs. 38.5% in DP 341; REo/RC: 55.9% vs. 39.7%), indicating that the Upland cotton cultivar had higher PSI capacity under heat stress. Virk et al. (2021) indicated that ΔVIPincreased with increasing growth temperature, with the highest values reported at 35°C and 40°C. The rise in ΔVIPand REo/RC with heat stress likely reflects a compensatory enhancement of PSI electron transport, helping to balance electron flow under stress (Zhang and Sharkey2009; Schrader et al.2004; Havaux et al.1991), and Upland cotton appeared more efficient than Pima in maintaining stable electron transport. In this context, “balancing electron flow” refers to maintaining redox equilibrium between the electron input from PSII and PSI's capacity to accept and process electrons. A sufficiently strong PSI electron sink may prevent upstream over‐reduction and alleviate electron pressure in the intersystem chain (Zhang and Sharkey2009), and may also help limit the formation of reactive oxygen species, thereby complementing the antioxidant‐based responses that contribute to thermotolerance in cotton (Khan et al.2026; Luqman et al.2025). Foundational studies support this interpretation: Havaux et al. (1991) demonstrated that PSI reaction centers close when their acceptor side becomes saturated, even as PSII centers remain comparatively open, and Schrader et al. (2004) further showed that PSI plays a dominant role in regulating thylakoid redox state under thermal stress. Thus, the increases in ΔVIPand RE₀/RC observed here likely represent compensatory adjustments that expand PSI's capacity to maintain electron flow under elevated temperatures. Upland cotton exhibited a greater increase in both ΔVIPand RE₀/RC than Pima cotton, suggesting that Upland cotton more effectively expanded PSI electron‐sink capacity when exposed to elevated growth temperature, representing a key interspecific difference in heat‐acclimation potential. Although the effect of long‐term heat stress on ΔVIPhas not been widely reported, studies on other abiotic stresses have shown that it is a highly sensitive indicator of PSI activity (Ceppi et al.2012; Oukarroum et al.2009). Similarly, the increases in the quantum yield of PSI end electron acceptor reduction (ΦRo) under high‐temperature conditions followed a trend similar to that of ΔVIPand REo/RC, supporting improved electron transport from PSI to the final electron acceptors in thylakoid reactions under elevated temperatures.
In photosynthetic tissues, when excess excitation energy resulting from stress cannot be used for photochemistry, plants often increase non‐photochemical quenching or rely on alternative mechanisms to prevent the accumulation of reactive oxygen species (Ledford and Niyogi2005; Demmig‐Adams and Adams Iii2006). These alternative mechanisms could include structural and functional adjustments in the photosystems, such as changes in antenna configuration or PSI:PSII stoichiometry (Allen2002; Allen and Pfannschmidt2000; Melis1999), thereby redistributing excitation energy between photosystems and modifying the redox balance of electron transport. Non‐photochemical dissipation, quantified here as DI₀/RC, represents one major protective mechanism that plants commonly employ under abiotic stress. Although in our study, ΦPoand DI₀/RC remained stable across growth temperatures for both species. The lack of change in DI₀/RC suggests that cotton seedlings did not depend on enhanced dissipation as a protective response to chronic heat. Instead, increases in the electron flux per RC to electron acceptors beyond QA(ET₀/RC) under heat stress further confirm that PSII reaction centers continued to efficiently drive electron transport beyond QA, supporting preserved linear electron flow and strong coordination with downstream acceptors such as PSI. Kaur, Snider, Parkash, et al. (2023) showed that the maximum quantum yield of PSII (reported as Fv/Fm) was stable under increased growth temperature. Similarly, other studies have reported the stable nature of PSII under high temperatures (Law and Crafts‐Brandner1999; Snider, Oosterhuis, and Kawakami2010; Adegbenro et al.2025; Snider et al.2013). The results of our study are consistent with findings in other heat‐stressed plants, where both PSII and PSI have been considered heat‐tolerant (Virk et al.2021; Sharkey2005).
Additionally, PSII and intersystem electron transport revealed contrasting responses of Upland and Pima cotton to optimal and elevated temperatures. At the optimum temperature (30°C/20°C), Pima cotton exhibited a higher quantum yield of inter‐photosystem electron transfer (ΦEo= 0.47) than Upland (ΦEo= 0.44), indicating more efficient electron transport beyond QAunder normal conditions. Under moderate heat (40°C/30°C), Upland increased ΦEoby 11%, reaching levels comparable to Pima, suggesting enhanced electron transport efficiency under elevated temperature. Also, the performance index representing the contribution of light reactions to primary photochemistry (Fv/F0) remained stable in Upland, indicating that PSII donor‐side activity was maintained (Strasser et al.2004; Strasser et al.2000). In contrast, Pima showed a slight decline, reflecting mild donor‐side stress. This suggests that Upland's increased ΦEounder heat was probably supported by intact donor‐side function, while in Pima, the slight donor‐side limitation may have constrained improvements in electron transport beyond QA.
Furthermore, a comparison of photosystem responses indicated that PSII maintained functional stability, whereas PSI performance improved significantly under chronic heat, especially in Upland cotton. For example, the performance index reflecting PSII function (PIABS) did not change with growth temperature (Table2), consistent with the stable quantum efficiency of PSII (ΦPo) and Fv/F0. In contrast, the total performance index (PITOTAL), which includes PSI activity, increased significantly under chronic high temperatures (by 130% in Upland and 79% in Pima). This indicates that more electrons were directed downstream toward PSI under heat stress. In other words, while PSII photochemistry remained stable under chronic heat stress, electron flow toward PSI was stimulated, leading to an overall increase in PITOTAL, which was more evident in Upland cotton. These changes, especially when supported by similar results for parameters like ΔVIP, REo/RC, and ΦRoagree with earlier studies suggesting that moderate heat may stimulate electron transport beyond QA(Virk et al.2021) and sometimes promote cyclic electron flow (Sharkey2005; Zhang and Sharkey2009), although the latter pathway was not directly assessed in our study. Also, to our knowledge, few studies have directly compared species‐level differences in thylakoid responses under chronic heat stress in cotton, particularly in terms of PSI activity. Our findings, therefore, provide evidence that Upland and Pima cotton may differ in their long‐term PSI performance. Prior cotton work using rapid induction fluorescence has mainly characterized cultivar‐ or genotype‐level variation, whether through field screening (Kaur, Snider, Paterson, et al.2023), or controlled growth‐temperature regimes (Kaur, Snider, Parkash, et al.2023; Adegbenro et al.2025), typically using T15thresholds for a limited set of parameters. Our study extends this to a between‐species comparison (Upland vs. Pima) across a broader set of OJIP parameters.
The second objective of this study was to assess the effects of growth temperature and cotton species on the sensitivity of specific thylakoid responses to acute high temperatures. Dark‐adapted OJIP measurements were obtained after exposure to rapid incubation temperatures to generate temperature response curves. For cotton plants grown under both optimal and elevated temperatures, the quantum yield of PSII (ΦPo) and some other indices (Fv/F0, PIABS) in response to acute heat stress were stable or peaked at moderate incubation temperatures (30°C–35°C), then declined at extreme temperatures (40°C–45°C). This pattern aligns with the known response of PSII to heat: moderate heat stress can temporarily enhance electron transport, whereas extreme temperatures lead to PSII inactivation (Hu et al.2018; Kaur, Snider, Paterson, et al.2023; Law and Crafts‐Brandner1999). However, ΦEopeaked at slightly higher temperatures (35°C–40°C), suggesting that the intersystem electron transport chain was more tolerant to acute high temperature than the photochemical reactions of PSII. This appears to contrast with other studies where ΦEowas more heat sensitive compared to PSII (Snider et al.2015; Adegbenro et al.2025; Hu et al.2018; Kaur, Snider, Paterson, et al.2023). While we do not have a clear mechanistic explanation for these trends, there are some methodological differences between the current study and previous chlorophyll fluorescence‐temperature response experiments. In the current experiment, measurements were done in a leaf chamber with leaves remaining attached to the plant. However, most acute temperature response experiments are done with detached leaves or leaf segments placed directly on a moist, heated surface rather than exposing the leaf tissue to the surrounding air (Adegbenro et al.2025; Kaur, Snider, Paterson, et al.2023; Hu et al.2018).
Furthermore, cotton plants grown at 40°C/30°C consistently showed higher values for these four parameters (ΦPo, ΦEo, Fv/F0, PIABS) across all acute incubation temperatures, compared to plants grown under the 30°C/20°C regime. In addition to these higher absolute values, plants exposed to higher growth temperatures exhibited smaller percentage declines in these parameters as incubation temperature increased from 30°C to 45°C. For example, ΦPodeclined by 8.2% in 30°C/20°C plants but by only 5.8% in 40°C/30°C plants at 45°C, and similar patterns were observed for ΦEo, Fv/F0, and PIABS. This implies that prior exposure to elevated growth temperatures enhanced the acute thermotolerance of these thylakoid responses (Berry and Bjorkman1980). Possible explanations for greater thermotolerance under elevated growth temperatures include increased expression of heat shock proteins, stabilization of D1 protein repair dynamics, and membrane lipid remodeling (Chen et al.2017; Heckathorn et al.1998; Rokka et al.2000; Theis and Schroda2016; Higashi et al.2018). This is well documented in the literature, where plants grown under warmer or cooler temperatures tend to show higher or lower thylakoid thermotolerance, respectively, compared to plants grown under normal conditions (Adegbenro et al.2025; Kaur, Snider, Parkash, et al.2023; Hu et al.2018; Snider et al.2013). The sustained PSII efficiency under acute heat stress in warm‐grown plants follows a pattern similar to that observed with chronic heat acclimation in objective one, in which ΦPoremained stable, and DI₀/RC was unaffected despite long‐term thermal stress, suggesting preserved photochemical integrity. Field data reported by Snider et al. (2013) support the notion that PSII can acclimate to prevailing air temperature conditions. Leaves exposed to more prolonged and intense high‐temperature environments consistently exhibited higher T15values (temperatures causing a 15% decline in thylakoid response), indicating improved PSII thermal tolerance. This increase in thermotolerance was positively correlated with ambient maximum temperatures, reinforcing the role of prior heat exposure in enhancing PSII resilience. Furthermore, controlled‐environment studies showed that increasing growth temperatures from 20°C/15°C to 40°C/30°C progressively raised the T15thresholds of ΦPoand ΦEo, with each 1°C increase in maximum daily temperature resulting in approximately 0.33°C and 0.39°C increases in T15ΦPoand T15ΦEo, respectively (Adegbenro et al.2025). Similarly, Kaur, Snider, Parkash, et al. (2023) reported that cotton plants grown at early‐season growth temperatures of 40°C/30°C exhibited higher temperature thresholds for ΦPothan plants grown at 30°C/20°C.
Irrespective of growth temperature, PSI‐related parameters (ΦRoand PITOTAL) increased from 30°C up to an optimum (35°C–40°C) and then collapsed at 45°C (Figure1A,B). In contrast to the PSII‐centered parameters, ΦRoand PITOTAL, which are more closely associated with PSI acceptor‐side activity, showed a delayed peak (around 40°C) before collapsing at 45°C, specifically for Upland cotton. This suggests that PSI‐end electron sinks and downstream acceptor capacity might be more thermally stable than PSII, which is consistent with the widely reported increases in PSI activity under moderate heat stress (Sun et al.2018; Schrader et al.2004; Boucher et al.1990; Havaux et al.1991). However, results from Kaur, Snider, Paterson, et al. (2023) and Hu et al. (2018) showed that both PSI and PSII did not differ significantly in thermotolerance. These contrasting outcomes likely reflect differences in experimental design. In our study, acute temperature responses were obtained from leaves that remained attached to intact plants and were heated by increasing the growth chamber air temperature. Although the exposure was acute, heating occurred via warm air rather than direct contact with a hot surface, allowing normal water and metabolic exchange during the temperature rise. In contrast, Hu et al. (2018) and Kaur, Snider, Paterson, et al. (2023) used leaf discs placed directly on a heated surface, resulting in much faster and more uniform tissue heating. Such rapid heating in those studies could have accelerated PSII inactivation and reduced the likelihood of detecting the enhanced PSI stability observed under more physiologically representative heating conditions, as in our study.
Upland cotton, which maintained higher ΦRoand PITOTALat 40°C compared to Pima (35°C), had a higher thermal optimum for PSI‐related processes. This higher optimum is consistent with our chronic heat results, in which Upland showed a greater enhancement of PSI acceptor‐side capacity (e.g., increases in ΔVIP, RE₀/RC, and ΦRo) under long‐term elevated temperatures compared with Pima. The acute temperature responses reinforce our findings on chronic heat, as the same PSI‐related adjustments (specifically, greater PSI electron‐sink capacity and enhanced downstream electron transport) are evident under both long‐term acclimation and short‐term thermal stress. Upland's higher thermal optimum for ΦRoand PITOTALfollows the observed increases in ΔVIP, RE₀/RC, and ΦRo, suggesting that the acclimation established under sustained heat directly contributes to improved PSI function when plants encounter sudden high temperatures. This agreement across time demonstrates that Upland's PSI machinery is more flexible and maintains electron‐sink capacity more effectively under heat, supporting a species‐level difference in thermal resilience (Adegbenro et al.2025). Our results contrast with studies reporting greater PSI thermotolerance in Pima (Kaur, Snider, Paterson, et al.2023; Kaur, Snider, Parkash, et al.2023). Notably, Kaur, Snider, Parkash, et al. (2023) found that Pima exhibited the lowest tolerance for growth and PSII‐related processes under high temperature, suggesting that PSI‐based thermotolerance alone did not translate to greater whole‐plant heat tolerance. These mixed patterns may reflect methodological differences: prior studies used detached leaf discs heated rapidly and uniformly on a hot surface, whereas our study assessed intact leaves on whole plants. As discussed previously, such rapid, uniform heating can alter PSI‐PSII comparative responses relative to the more gradual, physiologically representative heating of intact leaves. Taken together, our findings indicate that Upland cotton is more thermotolerant and is better equipped to maintain photosynthetic performance under both acute and prolonged heat stress.
A limitation of this study is that each species was represented by a single cultivar (DP 1646 B2XF and DP 341 RF). As a result, species‐level and cultivar‐level effects cannot be fully disentangled within the present design, and the differences reported here may partly reflect cultivar‐specific variation. Although the selected cultivars are commercially grown in the United States (Hutmacher2021; USDA‐AMS2020; Hand et al.2023), confirming species‐level generalizations would require evaluation of multiple cultivars per species (Iqbal et al.2019). The present findings should therefore be interpreted as cultivar‐level evidence consistent with, rather than definitive proof of, species‐level differences in thermotolerance, providing a basis for future multi‐cultivar studies.
Conclusions
Our findings demonstrate that acute heat stress responses closely mirrored patterns observed under chronic heat exposure, indicating that similar thylakoid adjustments operate across timescales in cotton. PSII photochemical efficiency was largely maintained under both conditions in Upland and Pima (DP 1646 and DP 341, respectively). In contrast, PSI‐related parameters were highly temperature‐responsive and were much enhanced under heat, particularly in DP 1646. DP 1646 exhibited more substantial increases in PSI acceptor‐side capacity (e.g., ΔVIP, RE₀/RC, ΦRo) and higher thermal optima for ΦRoand PITOTAL, alongside sustained electron transport beyond the primary plastoquinone acceptor (QA). These coordinated responses suggest that DP 1646 is more flexible in maintaining donor‐side function, redirecting electron flow, and supporting PSI under heat stress, reflecting a more robust long‐term acclimation strategy, while DP 341 exhibited weaker PSI adjustments. Together, these results provide new insight into how cotton partitions thermal tolerance between the two photosystems and highlight the importance of PSI‐related acclimation in cotton. Because each species was represented by a single cultivar, studies incorporating multiple cultivars per species will be needed to determine whether the patterns observed here generalize to Upland and Pima cotton more broadly.
Funding
This work was supported by Georgia Cotton Commission, Cotton Incorporated (23‐899), USDA National Institute of Food and Agriculture through the Hatch Research Capacity Fund, and USDA‐AFRI (2024‐67013‐42810).
Conflicts of Interest
The authors declare no conflicts of interest.
References
- Adegbenro, C. O. , J. L. Snider, V. Parkash, et al. 2025. “Effect of Cultivar Differences in Seed Size on Early Season Growth and Physiology of Cotton Under Low and High‐Temperature Extremes. ”Agrosystems, Geosciences & Environment8: e70113.
- Allen, J. F. 2002. “Plastoquinone Redox Control of Chloroplast Thylakoid Protein Phosphorylation and Distribution of Excitation Energy Between Photosystems: Discovery, Background, Implications. ”Photosynthesis Research73: 139–148. doi.org/10.1023/A:1020414106993
- Allen, J. F. , andT. Pfannschmidt. 2000. “Balancing the Two Photosystems: Photosynthetic Electron Transfer Governs Transcription of Reaction Centre Genes in Chloroplasts. ”Philosophical Transactions of the Royal Society of London. Series B: Biological Sciences355: 1351–1359. doi.org/10.1098/rstb.2000.0697
- Berry, J. , andO. Bjorkman. 1980. “Photosynthetic Response and Adaptation to Temperature in Higher Plants. ”Annual Review of Plant Physiology31: 491–543.
- Bibi, A. C. , D. M. Oosterhuis, andE. D. Gonias. 2008. “Photosynthesis, Quantum Yield of Photosystem II and Membrane Leakage as Affected by High Temperatures in Cotton Genotypes. ”Journal of Cotton Science12: 150–159.
- Boucher, N. , J. Harnois, andR. Carpentier. 1990. “Heat‐Stress Stimulation of Electron Flow in a Photosystem I Submembrane Fraction. ”Biochemistry and Cell Biology68: 999–1004. doi.org/10.1139/o90-147
- Burke, J. J. , andD. F. Wanjura. 2010. “Plant Responses to Temperature Extremes. ” InPhysiology of Cotton, edited byJ. M. Stewart, D. M. Oosterhuis, J. J. Heitholt, andJ. R. Mauney. Springer Netherlands.
- Ceppi, M. G. , A. Oukarroum, N. Çiçek, R. J. Strasser, andG. Schansker. 2012. “The IP Amplitude of the Fluorescence Rise OJIP is Sensitive to Changes in the Photosystem I Content of Leaves: A Study on Plants Exposed to Magnesium and Sulfate Deficiencies, Drought Stress and Salt Stress. ”Physiologia Plantarum144: 277–288. doi.org/10.1111/j.1399-3054.2011.01549.x
- Chastain, D. R. , J. L. Snider, J. S. Choinski, et al. 2016. “Leaf Ontogeny Strongly Influences Photosynthetic Tolerance to Drought and High Temperature inGossypium hirsutum. ”Journal of Plant Physiology199: 18–28. doi.org/10.1016/j.jplph.2016.05.003
- Chen, S. T. , N. Y. He, J. H. Chen, andF. Q. Guo. 2017. “Identification of Core Subunits of Photosystem II as Action Sites of HSP 21, Which is Activated by the GUN 5‐Mediated Retrograde Pathway in Arabidopsis. ”Plant Journal89: 1106–1118. doi.org/10.1111/tpj.13447
- Crafts‐Brandner, S. , andR. Law. 2000. “Effect of Heat Stress on the Inhibition and Recovery of the Ribulose‐1, 5‐Bisphosphate Carboxylase/Oxygenase Activation State. ”Planta212: 67–74. doi.org/10.1007/s004250000364
- Crafts‐Brandner, S. J. , andM. E. Salvucci. 2000. “Rubisco Activase Constrains the Photosynthetic Potential of Leaves at High Temperature and CO2. ”Proceedings of the National Academy of Sciences97: 13430–13435. doi.org/10.1073/pnas.230451497
- Demmig‐Adams, B. , andW. W. Adams Iii. 2006. “Photoprotection in an Ecological Context: The Remarkable Complexity of Thermal Energy Dissipation. ”New Phytologist172: 11–21. doi.org/10.1111/j.1469-8137.2006.01835.x
- Epron, D. 1997. “Effects of Drought on Photosynthesis and on the Thermotolerance of Photosystem II in Seedlings of Cedar (Cedrus atlanticaandC. libani). ”Journal of Experimental Botany48: 1835–1841.
- Froux, F. , M. Ducrey, D. Epron, andE. Dreyer. 2004. “Seasonal Variations and Acclimation Potential of the Thermostability of Photochemistry in Four Mediterranean Conifers. ”Annals of Forest Science61: 235–241.
- Hand, C. , S. Culpepper, G. Harris, et al. 2021. Georgia Cotton Production Guide. University of Georgia Extension.
- Hand, C. , C. Rowe, andW. Parker. 2023. “2022 UGA On‐Farm Cotton Variety Evaluation Program. University of Georgia Cooperative Extension. ”
- Havaux, M. , H. Greppin, andR. J. Strasser. 1991. “Functioning of Photosystems I and II in Pea Leaves Exposed to Heat Stress in the Presence or Absence of Light. ”Planta186: 88–98. doi.org/10.1007/BF00201502
- Heckathorn, S. A. , C. A. Downs, T. D. Sharkey, andJ. S. Coleman. 1998. “The Small, Methionine‐Rich Chloroplast Heat‐Shock Protein Protects Photosystem II Electron Transport During Heat Stress. ”Plant Physiology116: 439–444. doi.org/10.1104/pp.116.1.439
- Hejnák, V. , Ö. Tatar, G. D. Atasoy, et al. 2015. “Growth and Photosynthesis of Upland and Pima Cotton: Response to Drought and Heat Stress. ”Plant, Soil and Environment61: 507–514.
- Higashi, Y. , Y. Okazaki, K. Takano, et al. 2018. “Heat Inducible Lipase1 Remodels Chloroplastic Monogalactosyldiacylglycerol by Liberating α‐Linolenic Acid in Arabidopsis Leaves Under Heat Stress. ”Plant Cell30: 1887–1905. doi.org/10.1105/tpc.18.00347
- Holladay, S. K. , W. C. Bridges, M. A. Jones, andB. T. Campbell. 2021. “Yield Performance and Fiber Quality of Pima Cotton Grown in the Southeast United States. ”Crop Science61: 2423–2434.
- Hu, W. , J. L. Snider, D. R. Chastain, W. Slaton, andV. Tishchenko. 2018. “Sub‐Optimal Emergence Temperature Alters Thermotolerance of Thylakoid Component Processes in Cotton Seedlings. ”Environmental and Experimental Botany155: 360–367.
- Hutmacher, R. B. 2021. “2020 University of California Pima Cotton Variety Trials (6 February 2021 Update). Five Points, CA: University of California Cooperative Extension (UC ANR), Department of Plant Sciences, University of California, Davis, and West Side Research and Extension Center, Five Points, CA. ”
- Iqbal, M. , M. A. Khan, W. S. Chattha, K. Abdullah, andA. Majeed. 2019. “Comparative Evaluation ofGossypium arboreumL. andGossypium hirsutumL. Genotypes for Drought Tolerance. ”Plant Genetic Resources, Characterization and Utilization17: 506–513.
- Jagadish, S. K. , D. A. Way, andT. D. Sharkey. 2021. “Plant Heat Stress: Concepts Directing Future Research. ”Plant, Cell & Environment44: 1992–2005. doi.org/10.1111/pce.14050
- Kaur, N. , J. Snider, V. Parkash, A. Paterson, T. Grey, andV. Tishchenko. 2023. “Genotypic Variation in Growth, Single Leaf Physiology, and Acclimation Potential of Thylakoid Processes in Cotton Exposed to High Temperature Extremes. ”Environmental and Experimental Botany215: 105512.
- Kaur, N. , J. L. Snider, A. H. Paterson, et al. 2023. “Variation in Thermotolerance of Photosystem II Energy Trapping, Intersystem Electron Transport, and Photosystem I Electron Acceptor Reduction for Diverse Cotton Genotypes. ”Plant Physiology and Biochemistry201: 107868. doi.org/10.1016/j.plaphy.2023.107868
- Khan, Z. , N. Gul, M. Riaz, et al. 2026. “Oxidative‐Window Homeostasis in Cotton Under Drought and Heat Defines Climate Resilience and Guides Genotype Selection via the ROS‐Threshold Model. ”Plant Growth Regulation106: 5.
- Ladjal, M. , D. Epron, andM. Ducrey. 2000. “Effects of Drought Preconditioning on Thermotolerance of Photosystem II and Susceptibility of Photosynthesis to Heat Stress in Cedar Seedlings. ”Tree Physiology20: 1235–1241. doi.org/10.1093/treephys/20.18.1235
- Law, R. D. , andS. J. Crafts‐Brandner. 1999. “Inhibition and Acclimation of Photosynthesis to Heat Stress is Closely Correlated With Activation of Ribulose‐1, 5‐Bisphosphate Carboxylase/Oxygenase. ”Plant Physiology120: 173–182. doi.org/10.1104/pp.120.1.173
- Ledford, H. K. , andK. K. Niyogi. 2005. “Singlet Oxygen and Photo‐Oxidative Stress Management in Plants and Algae. ”Plant, Cell & Environment28: 1037–1045.
- Liu, Q. , D. J. Llewellyn, S. P. Singh, andA. G. Green. 2012. “Cotton Seed Development: Opportunities to Add Value to a Byproduct of Fiber Production. ” InFlowering and Fruiting in Cotton, Number Eight, The Cotton Foundation Reference Book Series, edited byD. M. OosterhuisandJ. T. Cothren, 133–162. Cotton Foundation.
- Liu, S. , M. Remley, F. M. Bourland, et al. 2015. “Early Vigor of Advanced Breeding Lines and Modern Cotton Cultivars. ”Crop Science55: 1729–1740.
- Luqman, T. , M. Hussain, S. R. Ahmed, et al. 2025. “Cotton Under Heat Stress: A Comprehensive Review of Molecular Breeding, Genomics, and Multi‐Omics Strategies. ”Frontiers in Genetics16: 2025. doi.org/10.3389/fgene.2025.1553406
- Maxwell, K. , andG. N. Johnson. 2000. “Chlorophyll Fluorescence—A Practical Guide. ”Journal of Experimental Botany51: 659–668. doi.org/10.1093/jxb/51.345.659
- Melis, A. 1999. “Photosystem‐II Damage and Repair Cycle in Chloroplasts: What Modulates the Rate of Photodamage in Vivo?”Trends in Plant Science4: 130–135. doi.org/10.1016/s1360-1385(99)01387-4
- OECD/FAO. 2023. OECD‐FAO Agricultural Outlook 2023‐2032. OECD Publishing.
- Oukarroum, A. , G. Schansker, andR. J. Strasser. 2009. “Drought Stress Effects on Photosystem I Content and Photosystem II Thermotolerance Analyzed Using Chl a Fluorescence Kinetics in Barley Varieties Differing in Their Drought Tolerance. ”Physiologia Plantarum137: 188–199. doi.org/10.1111/j.1399-3054.2009.01273.x
- Parkash, V. , J. Snider, K. J. Awori, J. R. Katta, C. Pilon, andV. Tishchenko. 2024. “Distinguishing High Daytime From Nighttime Temperature Effects During Early Vegetative Growth in Cotton. ”Journal of Agronomy and Crop Science210: e12757.
- Raphael, J. P. A. , B. Gazola, J. G. S. Nunes, G. C. Macedo, andC. A. Rosolem. 2017. “Cotton Germination and Emergence Under High Diurnal Temperatures. ”Crop Science57: 2761–2769.
- Reddy, K. , H. Hodges, andV. Reddy. 1992. “Temperature Effects on Cotton Fruit Retention. ”Agronomy Journal84: 26–30.
- Reddy, K. , V. Reddy, andH. Hodges. 1992. “Temperature Effects on Early Season Cotton Growth and Development. ”Agronomy Journal84: 229–237.
- Reddy, K. R. , D. Brand, C. Wijewardana, andW. Gao. 2017. “Temperature Effects on Cotton Seedling Emergence, Growth, and Development. ”Agronomy Journal109: 1379–1387.
- Reddy, K. R. , H. F. Hodges, andJ. M. Mckinion. 1997. “A Comparison of Scenarios for the Effect of Global Climate Change on Cotton Growth and Yield. ”Functional Plant Biology24: 707–713.
- Reddy, V. , K. Reddy, andD. Baker. 1991. “Temperature Effect on Growth and Development of Cotton During the Fruiting Period. ”Agronomy Journal83: 211–217.
- Rokka, A. , E. M. Aro, R. G. Herrmann, B. Andersson, andA. V. Vener. 2000. “Dephosphorylation of Photosystem II Reaction Center Proteins in Plant Photosynthetic Membranes as an Immediate Response to Abrupt Elevation of Temperature. ”Plant Physiology123: 1525–1536. doi.org/10.1104/pp.123.4.1525
- Sarwar, M. , M. F. Saleem, N. Ullah, et al. 2023. “Superior Leaf Physiological Performance Contributes to Sustaining the Final Yield of Cotton (Gossypium hirsutumL. ) Genotypes Under Terminal Heat Stress. ”Physiology and Molecular Biology of Plants29: 739–753. doi.org/10.1007/s12298-023-01322-8
- Scafaro, A. P. , B. C. Posch, J. R. Evans, G. D. Farquhar, andO. K. Atkin. 2023. “Rubisco Deactivation and Chloroplast Electron Transport Rates Co‐Limit Photosynthesis Above Optimal Leaf Temperature in Terrestrial Plants. ”Nature Communications14: 2820. doi.org/10.1038/s41467-023-38496-4
- Schrader, S. , R. Wise, W. Wacholtz, D. Ort, andT. Sharkey. 2004. “Thylakoid Membrane Responses to Moderately High Leaf Temperature in Pima Cotton. ”Plant, Cell & Environment27: 725–735.
- Sethar, M. , V. M. Pahoja, andQ. Chachar. 2002. “Heat Acclimation Potential of Chlorophyll Fluorescence of Cotton Cultivars. ”Pakistan Journal of Botany34: 275–282.
- Sharkey, T. D. 2005. “Effects of Moderate Heat Stress on Photosynthesis: Importance of Thylakoid Reactions, Rubisco Deactivation, Reactive Oxygen Species, and Thermotolerance Provided by Isoprene. ”Plant, Cell & Environment28: 269–277.
- Snider, J. , M. Bange, andJ. Heitholt. 2021. “Chapter 22—Cotton. ” InCrop Physiology Case Histories for Major Crops, edited byV. O. SadrasandD. F. Calderini. Academic Press.
- Snider, J. L. , D. R. Chastain, andG. D. Collins. 2015. “Field‐Grown Cotton Exhibits Seasonal Variation in Photosynthetic Heat Tolerance Without Exposure to Heat‐Stress or Water‐Deficit Conditions. ”Journal of Agronomy and Crop Science201: 312–320.
- Snider, J. L. , J. S. Choinski, andW. Slaton. 2010. “Juvenile Leaves ofRhus glabraHave Higher Photosynthetic Thermal Tolerance Than Mature Leaves. ”Botany88: 286–289.
- Snider, J. L. , andD. M. Oosterhuis. 2011. “How Does Timing, Duration and Severity of Heat Stress Influence Pollen‐Pistil Interactions in Angiosperms?”Plant Signaling & Behavior6: 930–933. doi.org/10.4161/psb.6.7.15315
- Snider, J. L. , andD. M. Oosterhuis. 2015. “Physiology. ”Cotton57: 339–400.
- Snider, J. L. , D. M. Oosterhuis, G. D. Collins, C. Pilon, andT. R. Fitzsimons. 2013. “Field‐AcclimatedGossypium hirsutumCultivars Exhibit Genotypic and Seasonal Differences in Photosystem II Thermostability. ”Journal of Plant Physiology170: 489–496. doi.org/10.1016/j.jplph.2012.11.004
- Snider, J. L. , D. M. Oosterhuis, andE. M. Kawakami. 2010. “Genotypic Differences in Thermotolerance are Dependent Upon Prestress Capacity for Antioxidant Protection of the Photosynthetic Apparatus inGossypium hirsutum. ”Physiologia Plantarum138: 268–277. doi.org/10.1111/j.1399-3054.2009.01325.x
- Snider, J. L. , D. M. Oosterhuis, B. W. Skulman, andE. M. Kawakami. 2009. “Heat Stress‐Induced Limitations to Reproductive Success inGossypium hirsutum. ”Physiologia Plantarum137: 125–138. doi.org/10.1111/j.1399-3054.2009.01266.x
- Snider, J. L. , N. Thangthong, C. Pilon, G. Virk, andV. Tishchenko. 2018. “OJIP‐Fluorescence Parameters as Rapid Indicators of Cotton (Gossypium hirsutumL. ) Seedling Vigor Under Contrasting Growth Temperature Regimes. ”Plant Physiology and Biochemistry132: 249–257. doi.org/10.1016/j.plaphy.2018.09.015
- Strasser, R. J. , andGovindjee. 1992. “The Fo and the O‐J‐I‐P Fluorescence Rise in Higher Plants and Algae. ” InRegulation of Chloroplast Biogenesis, edited byJ. H. Argyroudi‐Akoyunoglou. Springer US.
- Strasser, R. J. , A. Srivastava, andM. Tsimilli‐Michael. 2000. “The Fluorescence Transient as a Tool to Characterize and Screen Photosynthetic Samples. ”Probing Photosynthesis: Mechanisms, Regulation and Adaptation25: 445–483.
- Strasser, R. J. , M. Tsimilli‐Michael, S. Qiang, andV. Goltsev. 2010. “Simultaneous In Vivo Recording of Prompt and Delayed Fluorescence and 820‐nm Reflection Changes During Drying and After Rehydration of the Resurrection PlantHaberlea rhodopensis. ”Biochimica et Biophysica Acta, Bioenergetics1797: 1313–1326. doi.org/10.1016/j.bbabio.2010.03.008
- Strasser, R. J. , M. Tsimilli‐Michael, andA. Srivastava. 2004. “Analysis of the Chlorophyll a Fluorescence Transient. ” InChlorophyll a Fluorescence: A Signature of Photosynthesis. Springer.
- Strauss, A. J. , G. H. J. Krüger, R. J. Strasser, andP. D. R. VAN Heerden. 2006. “Ranking of Dark Chilling Tolerance in Soybean Genotypes Probed by the Chlorophyll a Fluorescence Transient OJIP. ”Environmental and Experimental Botany56: 147–157.
- Sun, Y. , Y. Gao, H. Wang, X. Yang, H. Zhai, andY. Du. 2018. “Stimulation of Cyclic Electron Flow Around PSI as a Response to the Combined Stress of High Light and High Temperature in Grape Leaves. ”Functional Plant Biology45: 1038–1045. doi.org/10.1071/FP17269
- Theis, J. , andM. Schroda. 2016. “Revisiting the Photosystem II Repair Cycle. ”Plant Signaling & Behavior11: e1218587. doi.org/10.1080/15592324.2016.1218587
- Thompson, A. L. , M. M. Conley, M. T. Herritt, andK. R. Thorp. 2022. “Response of Upland Cotton (Gossypium hirsutumL. ) Leaf Chlorophyll Content to High Heat and Low‐Soil Water in the Arizona Low Desert. ”Photosynthetica60: 280–292. doi.org/10.32615/ps.2022.014
- Unruh, B. L. , andJ. C. Silvertooth. 1996. “Comparisons Between an Upland and a Pima Cotton Cultivar: I. Growth and Yield. ”Agronomy Journal88: 583–589.
- USDA‐AMS. 2020. “Cotton Varieties Planted, 2020 Crop. Memphis, TN. ”
- USDA‐ERS. 2022. “USDA Economic Research Service‐Cotton and Wool. ”.
- Virk, G. , J. L. Snider, P. Chee, et al. 2021. “Extreme Temperatures Affect Seedling Growth and Photosynthetic Performance of Advanced Cotton Genotypes. ”Industrial Crops and Products172: 114025.
- Wise, R. R. , A. J. Olson, S. M. Schrader, andT. D. Sharkey. 2004. “Electron Transport is the Functional Limitation of Photosynthesis in Field‐Grown Pima Cotton Plants at High Temperature. ”Plant, Cell & Environment27: 717–724.
- Zhang, R. , andT. D. Sharkey. 2009. “Photosynthetic Electron Transport and Proton Flux Under Moderate Heat Stress. ”Photosynthesis Research100: 29–43. doi.org/10.1007/s11120-009-9420-8
Republished from the open web under CC-BY. Authors: Adegbenro CO, Parkash V, Snider JL, Tishchenko V. Read the original.