Oxidative Stress Induced Senescent Macrophage-Driven Squamous Cell Carcinoma Invasion via Glutamine Metabolic Reprogramming.
Oxidative stress drives tumor microenvironment (TME) remodeling by inducing metabolic reprogramming and cellular senescence. Glutamine, a key substrate supporting oxidative stress defense, has been implicated in TME remodeling and metastasis, yet its specific role in initiating tumor invasion remains unclear. Here, oxidative stress induced the generation of senescent macrophages in the TME, and clinical samples showed that their accumulation positively correlates with malignancy. We established cisplatin- and radiation-induced senescent macrophage models that exhibited distinct senescence-associated secretory phenotypes (SASP) and enhanced squamous cell carcinoma (SCC) migration and invasion. Integrated metabolomic and transcriptomic analyses revealed the glutamine-glutamate pathway as a central metabolic hub, with glutaminase 2 upregulated to drive glutaminolysis and strongly associated with IL-1β expression. Mechanistically, IL-1β secreted by senescent macrophages promoted tumor invasion by downregulating IL-1R2 and activating NF-κB signaling in SCC cells. Targeting the glutamine metabolism-regulated IL-1β/IL-1R2 axis effectively suppressed SCC invasion. These findings uncover a novel metabolic mechanism linking glutamine metabolism to SASP regulation and suggest a therapeutic strategy to limit SCC invasion.
Introduction
Squamous cell carcinoma (SCC) is a highly invasive malignancy arising from squamous epithelium and is characterized by substantial morbidity and metastasis (Li et al.2019; Yan et al.2011). Metastasis remains the leading cause of cancer‐related mortality and signifies the terminal phase of tumor progression. Because local invasion is the essential first step enabling metastatic dissemination (Graham and Shibata2020), clarifying the early events of SCC metastasis is critical for the development of effective preventive strategies.
Metabolic reprogramming is a defining hallmark of tumors. Among metabolic pathways, (Hanahan2022) glutamine metabolism has attracted considerable attention because of its dual function as a carbon and nitrogen source, estalishing its role as a “carbo–nitrogen hub” (Cluntun et al.2017). Through glutaminolysis, glutamine supplies α‐ketoglutarate to the tricarboxylic acid (TCA) cycle to support bioenergetics and anabolic processes, while glutathione (GSH) and nicotinamide adenine dinucleotide phosphate (NADPH) production to counter oxidative stress and preserve redox homeostasis (Gong et al.2022; Jin et al.2016). Tumors frequently exhibit pronounced glutamine dependence, or “glutamine addiction” (Quek et al.2022; Zou et al.2025). Aberrant reprogramming of glutamine metabolism not only sustains cancer cell proliferation and survival, but also drives tumor microenvironment (TME) remodeling, including activating cancer‐associated fibroblasts, enhancing immunosuppressive myeloid‐derived suppressor cell and Tregs functions, and promoting tumor‐supportive macrophage polarization (Zou et al.2025; Ma et al.2022; Hu et al.2023). Consequently, glutamine metabolism maintains cellular homeostasis while shaping a microenvironment that fosters tumor migration and invasion, positioning it as a major metabolic driver of the metastatic cascade.
Oxidative stress is another central force in TME remodeling. It forms a positive feedback loop with glutamine metabolism to enhance tumor adaptability and influences the fate of multiple cell types through reactive oxygen species (ROS) accumulation. Tumor‐infiltrating macrophages, in particular, exhibit notable heterogeneity in origin, differentiation, and secretory profiles (Kloosterman and Akkari2023; Liebold et al.2024). Their secretomes guide organotropic metastasis by facilitating pre‐metastatic niche formation through exosomes, chemokines, and the release of other modulatory factors. Under distinct stimuli, mature macrophages typically polarize toward M1 (classically) or M2 (alternatively) phenotypes, contributing to tumor suppression in early stages or tumor promotion in late/advanced stages, respectively (Kloosterman and Akkari2023; Duan and Luo2021). We previously demonstrated that macrophages enhance cancer expansion, invasion, and stemness through direct interactions with tumor cells (Gomez et al.2020; Wu et al.2019). Senescent macrophages in particular have been implicated in tumor initiation (Walters2023), although their effects on cancer invasion remain unknown. Evidence indicates that excessive ROS can drive macrophages toward senescence (Wang et al.2019; Danish et al.2025), suggesting oxidative stress as an important inducer of macrophage senescence and a potential determinant of early invasive behavior.
During senescence, macrophages undergo genome‐wide alterations, canonical biomarker activation, and assembly of a paracrine‐competent senescence‐associated secretory phenotype (SASP) (Muñoz‐Espín and Serrano2014). Increasing evidence highlights SASP as a key mediator linking senescent cells to TME remodeling and tumor progression (D'Ambrosio and Gil2023; Dong et al.2024). Notably, recent studies have demonstrated that senescent macrophages accumulate in premalignant lesions and contribute to malignant transformation via SASP‐mediated signaling in lung carcinogenesis (Prieto et al.2023; Haston et al.2023; Zheng et al.2025). These observations suggest that macrophage senescence is not merely a bystander effect but an active contributor to tumorigenesis. However, the mechanisms through which glutamine metabolism regulates SASP remain insufficiently defined. Our study demonstrates that oxidative stress–induced senescent macrophages undergo glutamine metabolic reprogramming and promote SCC invasion through SASP enhancement. Inhibiting glutamine‐dependent IL‐1β hypersecretion reduced invasion, revealing the glutamine–SASP axis as both a mechanistic insight and a promising metabolic target for anti‐invasion therapies.
Results
Increased Infiltration of Senescent Macrophages Correlates With Malignancy in HumanSCC
To clarify the role of senescent macrophages in SCC, we used co‐expression of CD68+/p16INK4a+/p53/E‐cadherin/Vimentin/Ki67 as the defining marker. Representative 7‐color multiplex immunofluorescence (mIF) images showed that, compared with normal and precancerous tissues, OSCC stroma exhibited extensive infiltration of senescent cells, with senescent macrophages being the most prominent population. In OSCC, the expression of Ki‐67 and p53 was markedly elevated within the epithelium, and the epithelial–stromal boundary appears blurred (Figure1a,b). The same pattern was independently validated in the CD68/p16, CD68/p16/Ki‐67, and CD68/p16/p53 multiplex co‐staining assays (FigureS1b–d). Quantitative analysis showed a stepwise and statistically significant increase in CD68+/p16INK4a+senescent macrophage infiltration across human oral normal mucosa, oral leukoplakia (OLK), and oral SCC (OSCC) (Figure1c). Because epithelial‐mesenchymal transition (EMT) is central to tumor invasion and metastasis (Glaviano et al.2025), we assessed EMT‐related proteins, including Vimentin and E‐cadherin. Quantitative immunohistochemistry (IHC) demonstrated increased Vimentin expression and decreased E‐cadherin expression during SCC progression (Figure1d; FigureS1a). Together, these findings indicate that senescent macrophage accumulation may be a strong predictor of SCC malignancy.
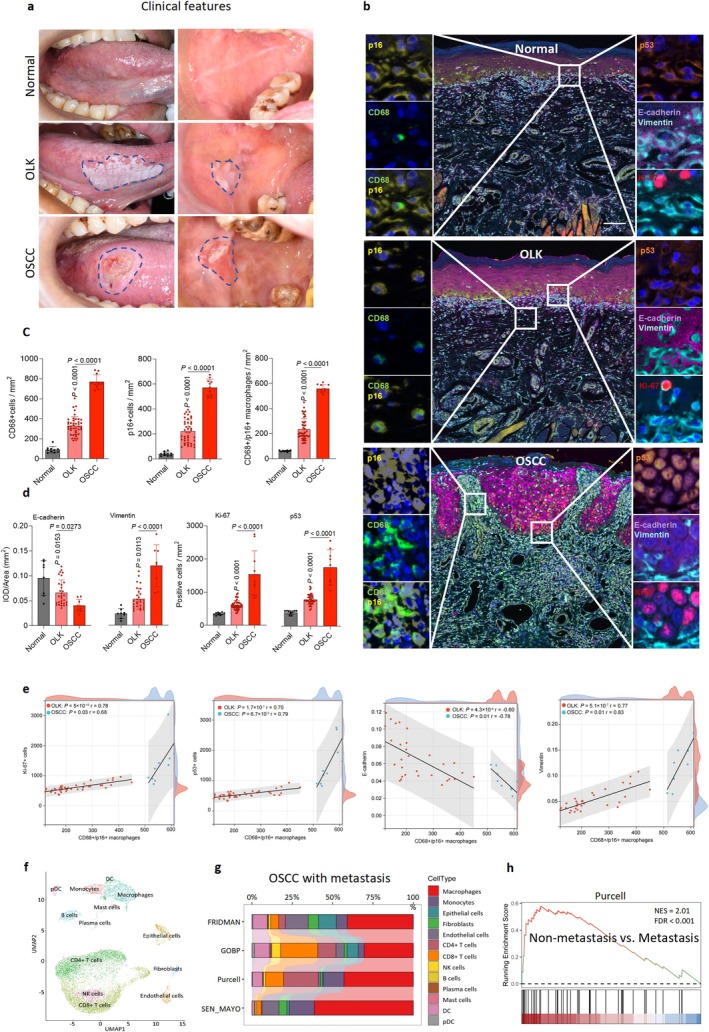
Senescent macrophages are closely related to human oral squamous cell carcinoma progression. (a) Clinical images are representative of human normal oral mucosa, oral leukoplakia (OLK) and oral squamous cell carcinoma (OSCC) in the tongue and buccal areas. (b) Representative 7‐color multiplex immunofluorescence (mIF) images showing the co‐expression of CD68, p16, p53, Ki‐67, E‐cadherin and Vimentin proteins in human oral normal mucosa, OLK, and OSCC patients. Scale bars, 100 μm. (c) Quantification of CD68, p16, and CD68/p16 in different human oral samples from each patient (CD68/p16 positive cells:N= 10 in normal,n= 43 in OLK,n= 11 in OSCC; CD68 and p16 positive cells:N= 9 in normal,n= 43 in OLK,n= 11 in OSCC). (d) Quantification of Ki‐67, p53, E‐cadherin and Vimentin in different human oral samples from each patient (Ki‐67/p53/E‐cadherin/Vimentin positive cells:N= 10/10/9/9 in normal,n= 42/42/30/30 in OLK,n= 9/9/9/8 in OSCC). (e) Pearson correlation analysis was performed to analyze the relationships between CD68+/p16+ senescent macrophages and Ki‐67+, p53+, Vimentin+, and E‐cadherin+ cells. (f) Uniform manifold approximation and projection (UMAP) of single‐cell RNA sequencing (scRNA‐seq) of all cells from metastasis OSCC, identifying 13 clusters. (g) Gene Set Enrichment Analysis (GSEA) results showing that these cells in scRNA‐seq data were annotated using gene module scores for senescent cells in the FRIDMAN Senescence, GOBP Cellular Senescence, Purcell and Sen MAYO datasets. (h) GSEA enrichment plot of bulk RNA sequencing of senescence‐associated genes between non‐metastasis OSCC and OSCC with metastasis in Purcell sets. Statistical significance was determined by permutation analysis. The percentage of positive cells was determined by one‐way ANOVA with Tukey's post hoc test (c, d).
Given the established roles of senescent stroma in shaping cancer cell behavior (Assouline et al.2024; Mori et al.2024), we hypothesized that senescent macrophages similarly influence SCC progression. Pearson correlation analysis showed that Vimentin, Ki‐67, and p53 were positively associated with CD68+/p16INK4a+senescent macrophages, whereas E‐cadherin was negatively associated with CD68+/p16INK4a+senescent macrophages in OLK and OSCC tissues (Figure1e). To support these observations, we performed single‐cell RNA sequencing (scRNA‐seq) and identified 17 cell clusters representing 13 annotated cell types in human OSCC tissues (Figure1f; FigureS1e,f). Immune cells were more abundant than epithelial cells or stromal cells. Single‐cell compositional bar plots revealed a marked dominance of senescent macrophages across tumor samples and a corresponding suppression of anti‐tumor immunity, including reduced infiltration of senescent CD8+ T cells (Figure1g). Moreover, senescence‐associated gene sets were significantly upregulated in OSCC with metastasis compared with non‐metastatic tumors (Figure1h; FigureS1g). Collectively, these findings support a promotive role of senescent macrophages in OSCC progression, particularly in regulating OSCC invasion and metastasis.
Oxidative Stress Leads to Macrophage Senescence and Adaptive Changes
Next, we established three in vitro oxidative stress–induced macrophage senescence models to investigate the role of macrophages in SCC invasion. Several agents, including D‐galactose, radiation, lipopolysaccharide, tamoxifen, acrylamide, andPseudomonas aeruginosa, have been reported to induce oxidative stress (Petrova et al.2016; Herranz and Gil2018). Accordingly, we triggered senescence in RAW264.7 and J774A.1 macrophages using D‐galactose, cisplatin, or ionizing radiation (FigureS2a). Because pH 6.0 β‐galactosidase (SA‐β‐gal) is a canonical senescence biomarker (Lee et al.2006), we assessed SA‐β‐gal activity in cisplatin‐ and radiation‐induced senescent macrophages and found that a 5‐day exposure to 1 μg/mL cisplatin or 10 Gy radiation most effectively induced SA‐β‐gal+macrophages in a dose‐ and time‐dependent manner (Figure2a; FigureS2b,d). Exposure of RAW264.7 macrophages to 10 mg/mL D‐galactose also induced SA‐β‐gal+cells (FigureS3a). Quantitative analysis of western blotting (WB) showed upregulation of p16, p21, Bcl‐2, Bcl‐XL, and p53 in senescent macrophages, with the exception of p53 in cisplatin‐treated J774A.1 cells and p16 in D‐galactose–treated RAW264.7 macrophages (Figure2j; FigureS3c–e). These findings suggest that cisplatin, radiation, and D‐galactose serve as robust, dose‐dependent triggers of macrophage senescence.
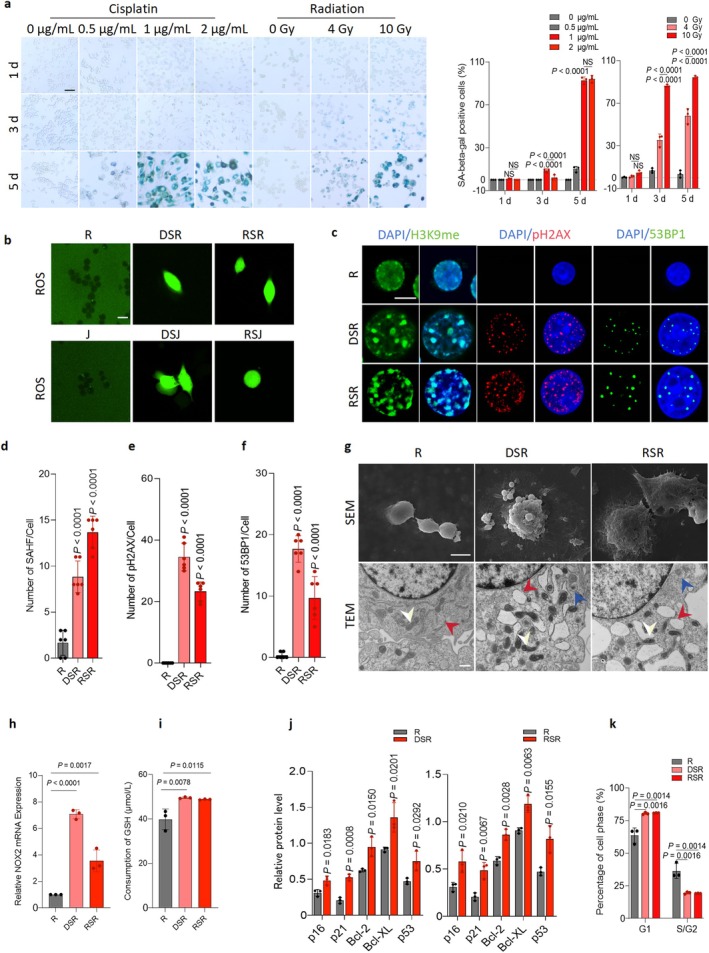
Oxidative stress damage caused by cisplatin or radiation induces senescence and adaptive changes in macrophages. (a) RAW264.7 cells (R) were treated with cisplatin (drug‐induced senescent RAW264.7 cells, DSR) or radiation (radiation‐induced senescent RAW264.7 cells, RSR) and stained for SA‐β‐Gal. Quantitation of the percentage of SA‐β‐Gal+ cells. Scale bars, 100 μm. (b) Representative immunofluorescence images for reactive oxygen species (ROS) in the senescent macrophages and controls (top: R, DSR, and RSR, bottom: J, DSJ, and RSJ). Scale bar, 20 μm. (c‐f) Representative fluorescence images of H3K9me, pH2AX and 53BP1. Quantitation of H3K9me (d), pH2AX (e) and 53BP1 (f). Scale bars, 10 μm. (g) Top: Scanning electron microscopy (SEM) images showing more phagocytic vacuoles than the controls. Scale bar, 200 μm. Bottom: Transmission electron microscopy (TEM) images showing mitochondrial shrinkage with increased electron density (white arrow), endoplasmic reticulum expansion with degranulation (red arrow) and phagocytic vacuoles (blue arrow). Scale bar, 500 nm. (h) Relative mRNA expression of NOX2 in DSR and RSR from RAW264.7 cells, respectively. (i) Concentration of GSH in R, DSR or RSR, respectively. (j) Relative protein expression of senescence‐associated proteins, including p16, p21, p53, Bcl‐2, and Bcl‐XL. (k) Histogram of flow cytometry with PI staining to address the cell cycle of senescent macrophages showing the cell proportions in different phases of G1 and G2/S.n = 3each group from independent biological replicates (a, h, i, j, k),n = 6each group for independent biological replicates (d, e, f). Statistical significance was determined by one‐way ANOVA with Tukey's post hoc test and the data are presented as the means ± s.d. (a, d, e, f, h, i, j, k).
We then assessed ROS accumulation and associated senescence damage, including DNA damage, and mitochondrial dysfunction, ROS levels were markedly elevated in senescent macrophages (Figure2b). NADPH oxidase 2 (NOX2), a key enzyme for ROS generation, showed significantly increased expression following cisplatin or radiation exposure (Figure2h). Nuclear DNA damage markers—histone H3 lysine‐9 methylation (H3K9me), phosphorylation of the histone family 2A variant X (pH2AX), and p53‐binding protein 1 (53BP1)—were also significantly elevated (Figure2c–f; FiguresS2c,eandS3b). Transmission electron microscopy revealed mitochondrial fragmentation, reduced organelle size, increased membrane density, and outer membrane discontinuities, consistent with oxidative injury (Figure2g; FigureS2g). Notably, intracellular glutathione (GSH) also increased significantly in senescent macrophages (Figure2i). Collectively, these results show that cisplatin and radiation induce oxidative stress, initiating macrophage senescence and adaptive metabolic responses.
Further, senescent macrophages exhibited cellular hypertrophy ultrastructural senescence features under inverted microscopy and scanning electron microscopy, including surface disorganization and abundant phagocytic vacuoles (Figure2g; FigureS2g,l,m). To assess phagocytosis, we confirmed that cisplatin‐ and radiation‐induced senescence significantly augmented phagocytic capacity in both RAW264.7 and J774A.1 macrophages (FigureS2h–i). Furthermore, we explored cell cycle progression, proliferation, and migration. Flow cytometry revealed a consistent shift toward G1‐phase accumulation with G2/S depletion across all senescent models (Figure2k; FiguresS2fandS3h). CCK‐8 assays demonstrated that 1 μg/mL cisplatin, 10 Gy radiation, and 10 mg/mL D‐galactose induced macrophage senescence while suppressing proliferation (FigureS3i–k). Additionally, cisplatin and radiation enhanced macrophage migratory capacity (FigureS2j–k). Taken together, these findings indicate that D‐galactose‐, cisplatin‐, or radiation‐induced senescence produces a coordinated phenotype characterized by structural derangements and functional alterations. Furthermore, to determine whether the senescent macrophages exhibit M1 or M2 characteristics, we assessed the expression of representative markers (CD86, TNF‐α and iNOS for M1, CD206, IL‐10, and arginase 1 for M2). The results showed reduced expression of CD86 and IL‐10, accompanied by increased expression of iNOS and arginase 1 (FigureS3l).
Glutamine Metabolic Reprogramming of Senescent Macrophages Regulated by Glutaminase 2 (GLS2)
Metabolic reprogramming is a key adaptive mechanism that enables cells to withstand oxidative stress. To identify metabolic alterations in senescent macrophages, we performed metabonomics profiling and identified 20 Kyoto Encyclopedia of Genes and Genomes (KEGG) pathways in cisplatin‐ or radiation‐induced senescent macrophages (FigureS4a,b). Eleven pathways overlapped between the two models, including central carbon metabolism in cancer, aminoacyl‐tRNA biosynthesis, and alanine, aspartate and glutamate metabolism (FigureS4c,d). Sankey analyses revealed 41 and 33 altered metabolites within these shared pathways in cisplatin‐ and radiation‐induced senescent macrophages, respectively (Figure3a,b). Further, we used a Venn diagram analysis to illustrate that there were 28 differentially abundant metabolites including L‐glutamine and L‐glutamic acid (Figure3c,d).
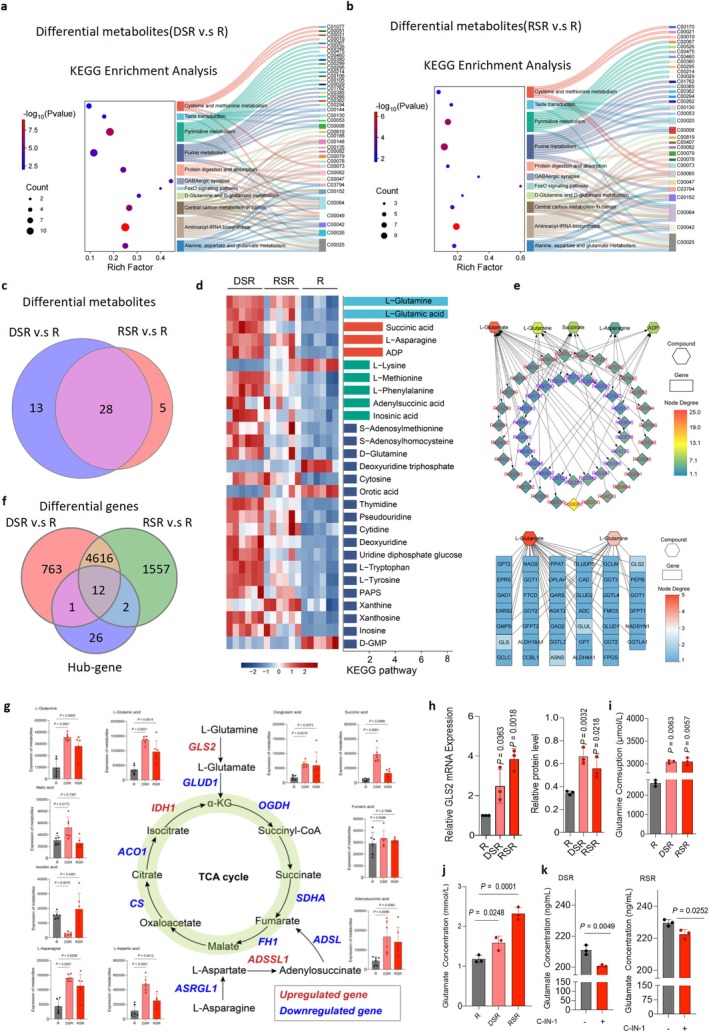
Glutamine metabolism in senescent macrophages is enhanced and regulated by GLS2. (a, b) Sankey diagrams illustrating metabolic alterations in senescent macrophages. In the DSR group, 37 altered metabolites were mapped to 11 metabolic pathways, while in the RSR group, 30 altered metabolites were associated with 11 pathways. Colors and labels highlight the close link between L‐glutamine and L‐glutamate (left) and glutamine metabolism (right). (c) Venn diagram showing the overlap of significantly altered metabolites associated with central carbon metabolism, alanine metabolism, aspartate metabolism, and glutamine metabolism in DSR or RSR. (d) Heat map of the top 28 altered metabolites from DSR or RSR (n= 6). (e) Bubble plots showing the results of gene‐metabolite KEGG joint enrichment analysis comparing the differential metabolites in senescent macrophages (DSR and RSR) with the control (R). The color of the points represented false discovery rate (FDR). (f) Venn diagram showing overlap of the significantly altered GLS2 gene related to central carbon metabolism, alanine metabolism, aspartate metabolism, and glutamine metabolism in DSR or RSR. (g) Quantitative analysis of metabolites in the glutamine metabolism pathway and differential expression of metabolic genes. Red indicates upregulated genes, and blue indicates downregulated genes. (h) Relative expression of GLS2 mRNA and protein in DSR and RSR from RAW264.7 cells. (i,j) ELISA results showing the glutamine consumption and glutamate concentration in CM from R, DSR or RSR, respectively. (k) Quantitative analysis results of glutamate content in the supernatant after using C‐IN‐1 to intervene in senescent macrophages (DSR, RSR). Statistical significance was determined by one‐way ANOVA with Tukey's post hoc test (g, h, i, k).
To determine gene‐level regulators of these altered metabolites, we performed RNA sequencing (RNA‐seq). Analysis using a fold change ≥ 2 identified 4628 commonly dysregulated genes across both senescent macrophages (FigureS5c,e). Additionally, MetScape network analysis of differentially abundant metabolites positioned glutamine–glutamate metabolism as the central metabolic hub and identified 41 associated core metabolic genes (Figure3e). Venn comparison between transcriptomic and metabolomic datasets identified overlapping hub genes (Figure3f). By prioritizing glutamine‐regulatory genes using log2(fold change) and network degree, we identified GLS2 as the most significantly upregulated regulator of glutaminolysis, catalyzing the conversion of glutamine to glutamate (Figure3g).
Consistent with these findings, senescent macrophages showed increased glutamine consumption, elevated glutamate levels, and heightened GLS2 expression (Figure3h–j; FigureS4j,l,m). Notably, pharmacological inhibition of GLS2 in senescent macrophages using C‐IN‐1 significantly reduced glutamate production compared to untreated controls (Figure3k; FigureS4k). Glucose consumption and lactate production were reduced, whereas adenosine triphosphate levels remained unchanged (FigureS4g–i). Senescent macrophages also exhibited decreased activity of specific TCA cycle enzymes but increased glutamine influx, supporting the accumulation of key metabolic intermediates (Figure3g). Gene set enrichment analysis (GSEA) of RNA‐seq data further revealed enrichment of senescence‐associated gene programs following cisplatin or radiation exposure, consistent with metabolic dysregulation (FigureS5d). Together, these results indicate cisplatin‐ and radiation‐induced senescent macrophages exhibit active glutamine metabolism.
Glutamine Metabolic Reprogramming DrivesIL‐1β Secretion in Senescent Macrophages
GSEA of RNA‐seq data showed marked enrichment of chemokine activity, cytokine activity, and SenMayo gene sets in senescent macrophages (Figure4a). To validate these transcriptomic findings, we used a MILLIPLEX assay to assess SASP secretion. Heatmap analysis revealed distinct secretome profiles in supernatants from the co‐culture model (Figure4b). IL‐1α, IL‐1β, and granulocyte‐macrophage colony‐stimulating factor (GM‐CSF) were significantly upregulated, whereas TNF‐α was significantly downregulated in senescent macrophages (Figure4c). Given the known myelopoietic role of GM‐CSF and the established suppression of TNF‐α in senescent macrophages (Guerrero et al.2024), we focused on IL‐1α and IL‐1β as potential dominant SASP effectors.
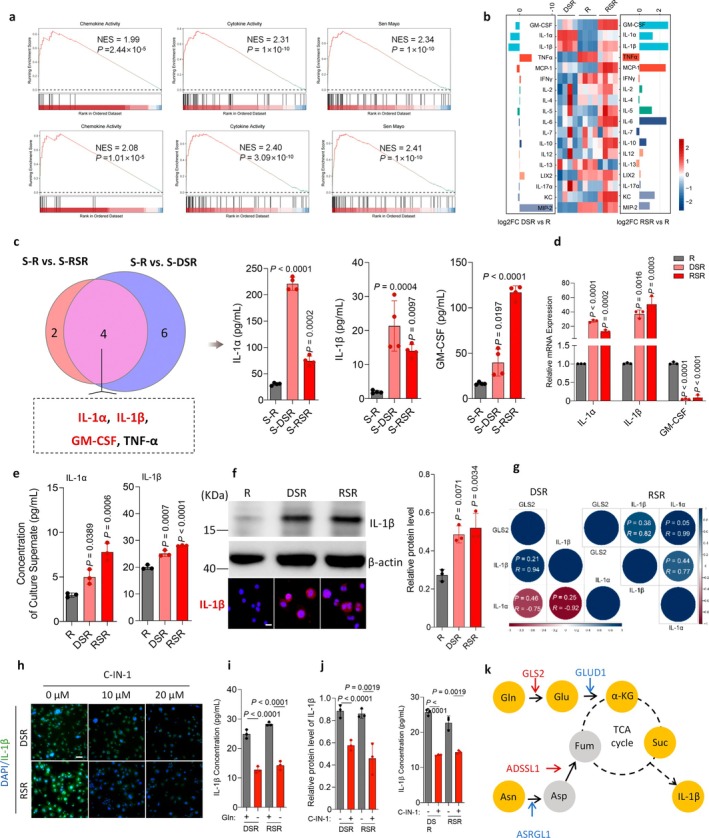
Glutamine metabolism in senescent macrophages drives the synthesis and secretion of IL‐1β. (a) GSEA results of senescent macrophages (DSR and RSR) in chemokine activity, cytokine activity, Sen Mayo sets. (b) Heat map in 18 cytokines of supernatants from direct co‐culture of SCC7 with macrophages (S‐R, S‐DSR or S‐RSR) assessed by the MILLIPLEX assay. (c) Venn diagram showing 4 differentially expressed cytokines including GM‐CSF, IL‐1α, IL‐1β, and TNF‐α in the supernatants. (d) Relative mRNA expression of GM‐CSF, IL‐1α, and IL‐1β in the DSR or RSR RAW264.7 cells. (e) ELISA determination of increased IL‐1β levels in the supernatants of DSR and RSR. (f) Immunoblots and representative immunofluorescence images of IL‐1β in the intracellular protein of R, DSR, and RSR. (g) Pearson correlation analysis showing a significant positive correlation between GLS2 and IL‐1α/β. (h) Representative immunofluorescence images of IL‐1β in DSR or RSR treated with different concentrations of C‐IN‐1. Scale bars, 50 μm. (i) IL‐1β expression analysis under different glutamine‐deprivation conditions in DSR or RSR. (j) Immunoblots and ELISA results showing IL‐1β levels in DSR or RSR treated with 20 μM C‐IN‐1. (k) KEGG pathway analysis of altered gene and metabolites in senescent macrophages. Increased glutamine metabolism in senescent macrophages was involved in central carbon metabolism through entry into the tricarboxylic acid cycle (TCA cycle): Yellow dots, increased metabolites; gray dots, no significantly changed metabolites; red arrows, increased genes; blue arrows, decreased genes.n= 3 in each group from independent biological replicates (d, e, f, i, j),n= 4 in each group from independent biological replicates (c). Statistical significance was determined by one‐way ANOVA with Tukey's post hoc test; mean ± s.d. (c, d, e, f, i, j).
qRT‐PCR analysis confirmed increased IL‐1α and IL‐1β mRNA, with reduced GM‐CSF in senescent macrophages supernatants (Figure4d; FigureS7k). Although immunofluorescence staining showed elevated intracellular IL‐1α and IL‐1β (Figure4f; FigureS7L), extracellular IL‐1α showed elevated intracellular in conditioned medium (CM) from cisplatin‐induced J774A.1 senescent macrophages (Figure4e; FigureS7m). Consistent with the previous data, IL‐1β increased significantly in both extracellular and intracellular protein levels by ELISA, WB, and immunofluorescence assays (Figure4e,f; FigureS7m,n). Thus, IL‐1α accumulation occurred intracellularly without active secretion. Consistent with the previous data, IL‐1β increased significantly in both extracellular and intracellular protein levels by ELISA, WB, and immunofluorescence assays (Figure4e,f; FigureS7m,n). These results establish IL‐1β as a key SASP effector in senescent macrophages.
Next, we assessed correlation among these genes using Pearson correlation coefficient and identified a statistically significant positive association between GLS2 and IL‐1β (Figure4g). To explore the effects of upregulated GLS2 on IL‐1β, we removed exogenous glutamine from the senescent macrophages and observed a significant reduction in IL‐1β levels (Figure4i; FigureS5k). Because GLS2 catalyzes the conversion of glutamine to glutamate, we further inhibited glutamine metabolism with the GLS‐specific inhibitor C‐IN‐1; cellular immunofluorescence staining and WB analysis showed that C‐IN‐1 substantially suppressed IL‐1β expression in senescent macrophages (Figure4h,j; FigureS5g–j). Together, these findings suggest that glutamine availability and GLS2 activity drive IL‐1β expression in senescent macrophages and that this process is reversible through GLS inhibition (Figure4k).
Senescent Macrophages AccelerateSCCInvasion by aSASP
To investigate how the senescent macrophage secretome influences SCC progression, we examined biological responses in SCC‐7 cells. CM from cisplatin‐ or radiation‐induced senescent macrophages significantly reduced SCC‐7 cell proliferation, accompanied by a decrease in G2/S‐phase cells as shown by CCK‐8 and flow cytometry assays (FigureS6a,e–g). Colony formation assays demonstrated that senescent macrophages' CM significantly reduced SCC‐7 colony numbers and size (FigureS6b). Notably, SCC‐7 cells remained SA‐β‐gal negative and showed no substantial changes in senescence‐related protein expression following CM or transwell exposure (FigureS6c,d). These results indicate that senescent macrophages suppress SCC‐7 proliferation in vitro through paracrine mechanisms but do not transmit senescence programs.
We then evaluated the impact of senescent macrophages on SCC invasion. CM or transwell co‐culture with senescent macrophages significantly enhanced SCC‐7 invasion and migration (Figure5a; FigureS6h–k). Similarly, scratch and transwell assays demonstrated that senescent macrophage CM or co‐culture accelerated wound closure within 18 h (FigureS7a–c). As Vimentin and E‐cadherin expression changes are frequently observed in cancer cells and are correlated with increased invasiveness (Tian et al.2020), we assessed these markers by immunofluorescence staining and found that SCC‐7 cells co‐cultured with senescent macrophages exhibited elevated Vimentin and reduced E‐cadherin expression relative to controls (Figure5c; FigureS7d).
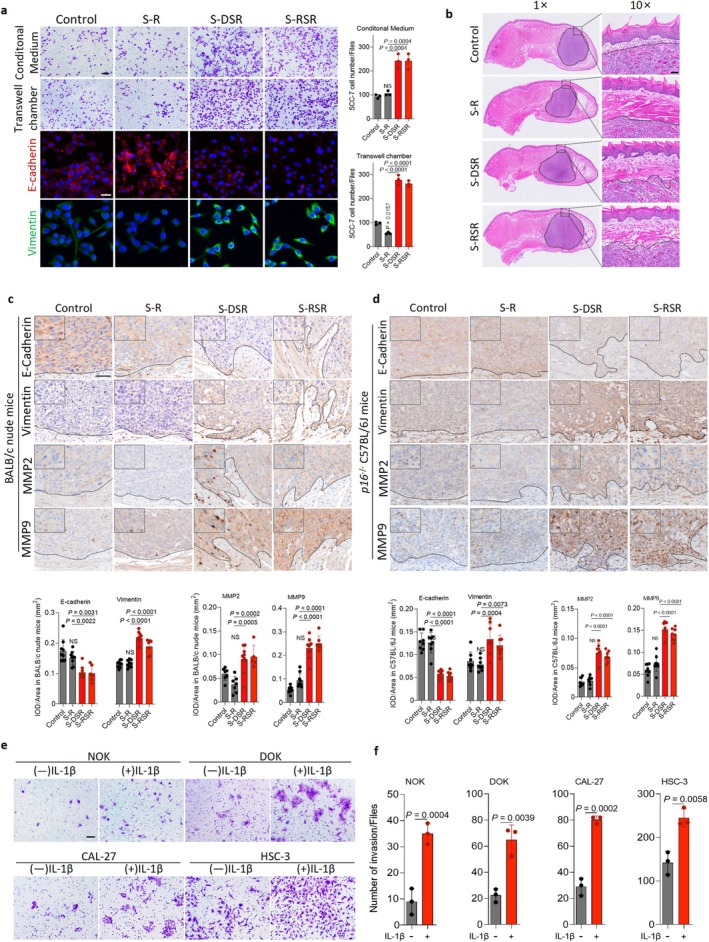
Senescent macrophages secrete IL‐1β for promoting oral cancer invasion. (a) Top: Representative images and quantification of invasion in transwell assays using conditioned medium (CM) or co‐culture with R, DSR or RSR. SCC‐7 cells were treated with CM derived from R, DSR or RSR. Bottom: Representative immunofluorescence images of E‐cadherin and Vimentin in SCC‐7 cells co‐cultured in transwell chamber under different conditions (alone, R, DSR, RSR, J, DSJ or RSJ). Scale bar, 100 μm (top) and 50 μm (bottom). (b) H&E staining images of tongue orthotopic OSCC xenograft model. Scale bar, 50 μm. (c‐d) Representative IHC images and quantification analysis of E‐cadherin, Vimentin, MMP2 and MMP9 staining in tumor sections from BALB/c nude mice andp16−/−C57BL/6J mice implanted with SCC‐7 cells with or without macrophages. BALB/c nude mice model: SCC‐7 cells alone (n= 9), SCC‐7 cells and RAW264.7 cells (S‐R) (n= 9), SCC‐7 cells and DSR (S‐DSR) (n= 10), SCC‐7 cells and RSR (S‐RSR) (n= 7).p16−/−C57BL/6J mice model: SCC‐7 cells (n= 8), S‐R (n= 8), S‐DSR (n= 8), and S‐RSR (n= 8). Scale bar, 50 μm. (e‐f) Representative images and quantification of invasion assays. Human derived cell lines including normal oral keratinocytes (NOK), dysplastic oral keratinocytes (DOK), tongue squamous cell carcinoma cells (CAL‐27) and OSCC cells (HSC‐3) were treated with exogenous IL‐1β. Scale bar, 100 μm.n= 3 in each group from independent biological replicates (a, e). Statistical significance was determined by one‐way ANOVA with Tukey's post hoc test; mean ± s.d. (a, c, d, f).
Moreover, to determine whether senescent macrophages consistently promote EMT‐mediated invasion in vivo, we generated SCC models in immunodeficient nude mice andCdkn2a−/−C57BL/6 mice by co‐injecting SCC‐7 cells with cisplatin‐ or radiation‐induced senescent macrophages (FigureS7e–g). Our data showed that tumors from mice co‐injected with SCC‐7 cells and senescent macrophages exhibited upregulation of Vimentin, MMP‐2, and MMP‐9, and downregulation of E‐cadherin (Figure5b–d; FigureS7i–j). To evaluate whether IL‐1β is required for SCC invasion, we treated cells with recombinant IL‐1β in transwell assays and found that it significantly enhanced migration and invasion in normal human keratinocytes (NOK), premalignant cells (dysplastic oral keratinocyte [DOK]), and malignant oral epithelial cells (CAL‐27 and HSC‐3) (Figure5e,f; FigureS8a). Recombinant IL‐1β significantly accelerated scratch wound closure across oral epithelial cell models: with DOK and CAL‐27 responding by 24 h, NOK by 48 h, and metastatic HSC‐3 by 10 h (FigureS8b–d). Together, these results demonstrate that senescent macrophages drive SCC invasion by inducing EMT activation through paracrine signaling, promoting mesenchymal reprogramming from 2D models to immunocompetent (Cdkn2a−/−) and immunodeficient xenograft systems.
Senescent Macrophage‐DerivedIL‐1β DrivesSCCInvasion ThroughIL‐1R2/NF‐κBSignaling
Next, we explored the mechanism by which IL‐1β enhanced OSCC invasion. To investigate potential target molecules, we applied the GSEA algorithm and identified gene sets and downstream signals associated with the IL‐1 receptor (IL‐1R) pathway in OSCC cells (Figure6a). We further assessed IL‐1 receptor expression, including IL‐1R1 and IL‐1R2, by Western blot. The results showed a significant downregulation of IL‐1R2, with no obvious change in IL‐1R1, in SCC‐7 cells incubated with senescent macrophages. Consistently, qRT‐PCR analysis demonstrated that IL‐1R2 mRNA expression was also significantly decreased under the same conditions (Figure6b,g). Consistently, in two xenograft models, tumors originating from SCC‐7 cells and senescent macrophages exhibited markedly reduced IL‐1R2 expression, while IL‐1R1 remained unchanged (Figure6c,d). These findings suggest that senescent macrophage‐derived IL‐1β promotes SCC invasion through IL‐1R2‐dependent signaling derepression.
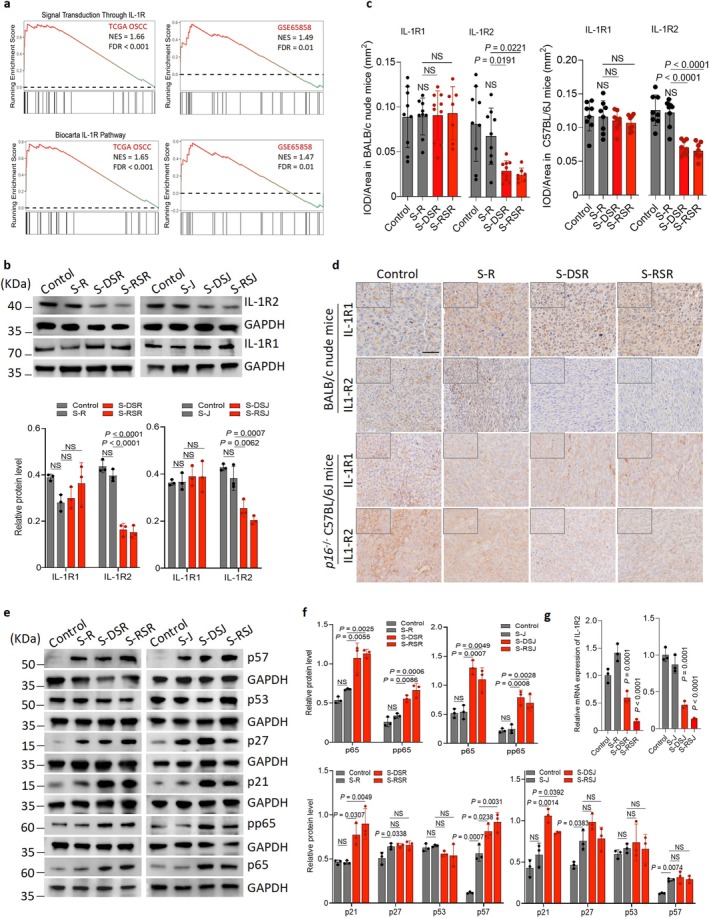
Senescent macrophage‐derived IL‐1β drives oral cancer invasion via the IL‐1β/IL‐1R/NFκB signaling cascade. (a) Gene Set Enrichment Analysis (GSEA) results of OSCC tissues from the TCGA andGSE65858datasets in Signal Transduction Through IL‐1R and Biocarta IL‐1R pathway sets. (b, c) Immunoblots and quantification of IL‐1R1 and IL‐1R2 levels in SCC‐7 cells indirectly co‐cultured with R, DSR, RSR, J774A.1 cells (J), DSJ or RSJ. (d) Representative IHC images of IL‐1R1 and IL‐1R2 staining in tumor sections from BALB/c nude mice andp16−/−C57BL/6J mice implanted with SCC‐7 cells with/without macrophages. BALB/c nude mice model: SCC‐7 cells (n= 9), S‐R (n= 9), S‐DSR (n= 10), S‐RSR (n= 7).p16−/−C57BL/6J mice model: SCC‐7 cells (n= 8), S‐R (n= 8), S‐DSR (n= 8), and S‐RSR (n= 8). Scale bar, 50 μm. (e, f). Immunoblots and quantification of p21, p27, p53, p57, p65, and pp65 levels in SCC‐7 cells indirectly co‐cultured with R, DSR, RSR, J, DSJ or RSJ. (g) Relative expression of IL‐1R2 mRNA in senescent macrophage.n= 3 in each group from independent biological replicates and statistical significance was determined by one‐way ANOVA with Tukey's post hoc test; mean ± s.d. (b, f).
Given that nuclear factor‐kappaB (NF‐κB) in cancer cells is closely associated with cellular invasion, and our results indicated enhanced SCC‐7 invasion induced by senescent macrophage‐derived IL‐1β (Kaur et al.2023), a likely link exists between the NF‐κB signaling cascade and senescent macrophage‐driven SCC invasion. To test this, we performed WB and observed significant upregulation of the major NF‐κB subunit p65 when SCC‐7 cells were indirectly co‐cultured with senescent macrophages (Figure6e,f). Next, we examined activation of the NF‐κB pathway, particularly p65 phosphorylation (pp65), and found increased pp65 levels in indirectly co‐cultured SCC‐7 cells (Figure6e,f). These findings indicate that NF‐κB signaling may mediate the invasive response of cancer cells to senescent macrophages.
Notably, although NF‐κB signaling typically promotes proliferation in cancers (Kumar et al.2021), we demonstrated that its activation in senescent macrophages suppressed proliferation while enhancing invasiveness, suggesting that these functions are uncoupled. Because cyclin‐dependent kinases are critical for cell proliferation and their inhibitors (CKIs) including p21, p27, and p57 suppress this process (Zhang et al.2021), we assessed CKI expression of CKIs in SCC‐7 cells. Our data showed that p21 increased significantly in SCC‐7 cells indirectly co‐cultured with senescent macrophages, whereas p27 and p57 did not exhibit consistent increases (Figure6e,f). Furthermore, no significant change in p53 expression was detected in co‐cultured SCC‐7 cells (Figure6e,f).
Collectively, these results suggest that senescent macrophage‐derived IL‐1β promotes SCC invasion through IL‐1R2/NF‐κB signaling via p65 phosphorylation while suppressing cell proliferation through an IL‐1R2/p21 signaling cascade.
IL‐1β Blockage AttenuatesSCCInvasion Induced by Senescent Macrophages
To identify senescent macrophage‐derived IL‐1β in SCC invasion, we performed transwell assays using a neutralizing antibody (Figure7a). Anti‐IL‐1β antibody treatment significantly reduced the invasive and migrative abilities of SCC‐7 cells induced by senescent macrophage‐derived CM or the indirect co‐culture system (Figure7b; FigureS8e,f,h). Together, these findings demonstrated that senescent macrophage‐derived IL‐1β is a key driver of SCC invasion, and that blocking IL‐1β effectively suppresses this pro‐invasive response.
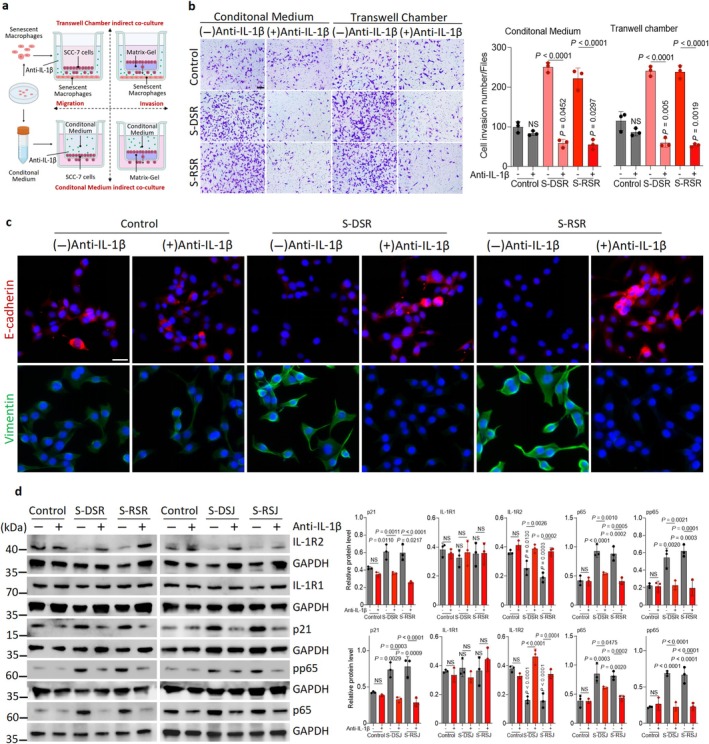
Exogenous recombinant IL‐1β promotes oral cancer invasion and blocking IL‐1β attenuates this process and downstream signaling pathway. (a) Schematic of the migration and invasion transwell assays. Briefly, SCC‐7 cells in a transwell chamber were challenged to migrate through transwell with 5 μm pores. For the invasion assay, SCC‐7 cells were seeded at the bottom of the transwell chambers that had been coated with matrigel. The migration or invasion of SCC‐7 cells was induced by senescent macrophage‐derived CM or indirect co‐culture with senescent macrophages. (b) Representative images and quantification of invasion assays after treatment with an anti‐IL‐1β antibody. Scale bar, 100 μm. (c) Representative images of immunofluorescence staining of E‐cadherin and Vimentin in SCC‐7 indirectly co‐cultured with DSR or RSR, treated with or without anti‐IL‐1β antibody. Scale bars, 100 μm. (d) SCC‐7 cells indirectly co‐cultured with senescent macrophages were treated with an anti‐IL‐1β antibody. Immunoblots of p21, IL‐1R1, IL‐1R2, p65, and pp65 levels in SCC‐7 cells.n= 3 in each group from independent biological replicates and statistical significance was determined by one‐way ANOVA with Tukey's post hoc test; mean ± s.d. (b, d).
We next investigated the mechanism by which senescent macrophage‐derived IL‐1β promoted SCC invasion. Immunofluorescence staining showed that anti‐IL‐1β antibody treatment increased E‐cadherin expression while reducing Vimentin levels in SCC‐7 cells indirectly co‐cultured with senescent macrophages (Figure7c; FigureS8g). As described above, senescent macrophage‐derived IL‐1β upregulated NF‐κB and p21, and downregulated IL‐1R2. Therefore, we hypothesized that anti‐IL‐1β might reverse these alterations. As expected, WB demonstrated that the antibody significantly reduced p21, p65, and pp65 levels in SCC‐7 cells exposed to senescent macrophages (Figure7d). Notably, anti‐IL‐1β antibody substantially increased IL‐1R2 expression in SCC‐7 cells while exerting no effect on IL‐1R1 level (Figure7d). In sum, these results indicate that IL‐1β blockade reverses senescent macrophage‐driven EMT and NF‐κB/p21 activation in SCC by restoring IL‐1R2, therefore leading to reduced SCC invasion.
BlockingIL‐1β Restores Epithelial Traits and Reduces the Invasive Behavior ofSCCIn Vivo
The above findings showed that GLS2 markedly increased IL‐1β secretion in senescent macrophages. To further validate the contribution of senescent macrophage‐derived IL‐1β to SCC invasion, we established a nude mouse subcutaneous model in which SCC‐7 cells were transplanted with or without senescent macrophages. Intriguingly, unlike the suppressive effect of the anti‐IL‐1β antibody on SCC invasion, C‐IN‐1 treatment, either alone or combined with the anti‐IL‐1β, decreased E‐cadherin expression and increased Vimentin levels in tumor tissues (Figure8a). Likewise, C‐IN‐1 alone or combined with anti‐IL‐1β significantly enhanced SCC‐7 cell invasion and migration (FigureS9d). Because C‐IN‐1 inhibited glutamine metabolism, we questioned how tumor cells obtained energy to sustain invasive behaviors. IHC staining showed that C‐IN‐1 activated HIF‐1α and PKM2, thereby promoting glycolysis and fueling tumor progression (FigureS9f).
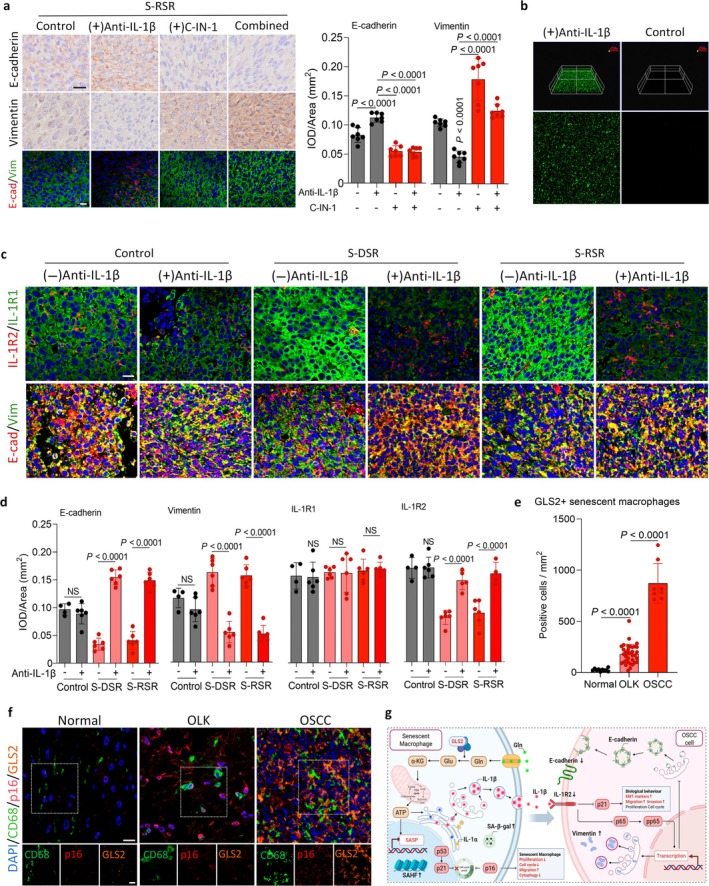
Inhibition of IL‐1β reduces Vimentin and increases E‐cadherin to suppress OSCC invasion in vivo. (a) Representative IHC and mIHC images, and quantification of E‐cadherin and Vimentin in tumor sections from S‐RSR treated with anti‐IL‐1β antibody, C‐IN‐1, or a combination of the anti‐IL‐1β antibody and C‐IN‐1 (n= 7 independent biological replicates for each group). Scale bars, 20 μm (upper), 20 μm (bottom). (b) Representative images showing anti‐IL‐1β antibody in 15% w/v PLGA‐PEG‐PLGA gel. (c, d) Representative mIHC images (c) and quantification (d) of E‐cadherin, Vimentin, IL‐1R1 and IL‐1R2, in nude mice bearing tumor derived from SCC‐7 cells alone, S‐DSR or S‐RSR treated with or without the anti‐IL‐1β antibody (n= 6 in the comparisons exceptn= 4 in the group of SCC‐7 cells alone + vehicle). Scale bars, 20 μm. (e, f) Representative mIHC images (f) and quantification (e) of CD68, p16, and GLS2 in normal human oral mucosa, OLK and OSCC tissues (n= 10 in normal,n= 38 in OLK,n= 8 in OSCC). Scale bars, 20 μm (upper), 10 μm (bottom). (g) Schematic illustrating GLS2+ senescent macrophages with activated glutamine metabolism promote Vimentin expression and suppress E‐cadherin during OSCC invasion. The glutamine metabolism/IL‐1β/IL‐1R/NFκB pathway is critical for this process, but it can be inhibited by blocking IL‐1β. Statistical significance was determined by one‐way ANOVA with Tukey's post hoc test; mean ± s.d. (a, d, e).
To enhance the therapeutic effect of an exogenous IL‐1β inhibitor in vivo, we loaded the anti‐IL‐1β antibody into 15% w/v PLGA‐PEG‐PLGA for treatment (Figure8b). We injected the anti‐IL‐1β antibody gel into the nude mice bearing tumors originating from SCC‐7 cells and senescent macrophages, and observed that the gel increased E‐cadherin expression while significantly reducing Vimentin levels compared with the controls (FigureS9h). Injection of the anti‐IL‐1β antibody gel also markedly increased IL‐1R2 expression in tumors derived from SCC‐7 cells and senescent macrophages, with no evident change in IL‐1R1 (Figure8c,d; FigureS9h). In contrast, in controls, the antibody gel did not alter E‐cadherin, Vimentin, IL‐1R1 or IL‐1R2 in tumors originating from SCC‐7 cells alone (Figure8c,d: FigureS9h). Tumor weight showed no significant differences among groups treated with the anti‐IL‐1β antibody gel (FigureS9g). In a clinical context, mIHC staining demonstrated significantly increased infiltration of CD68+/p16INK4a+/GLS2+senescent macrophages across human oral normal mucosa, OLK, and OSCC tissues (Figure8e,f). Overall, these findings suggest that senescent macrophage‐derived IL‐1β promotes SCC invasion through the IL‐1β/IL‐1R2 pathway, and that targeting this axis with anti‐IL‐1β antibody delivered via PLGA‐PEG‐PLGA can substantially inhibit SCC invasion.
Discussion
Globally, > 90% of patients with cancer succumb to metastasis, and available therapeutic options remain limited because conventional treatments struggle to halt the metastatic progression in cancers (Gerstberger et al.2023). As cellular invasion is a central hallmark of cancer metastasis (Hanahan2022), there is an urgent need to identify novel anti‐invasive approaches to improve treatment outcomes (Yang et al.2026; Kwa et al.2026). In this study, we found that senescent macrophages exhibit enhanced GLS2‐driven glutamine metabolism, and their upregulated IL‐1β promotes SCC cell invasion in an IL‐1R2‐dependent manner. Targeting senescent macrophage‐derived IL‐1β reduced Vimentin expression and increased E‐cadherin expression, thereby suppressing the EMT process. These findings underscore the potential promotive role of senescent macrophages in SCC invasion.
The concept of “oxidative stress” in redox biology, first proposed by Sies in 1985, describes disrupted redox homeostasis caused by an imbalance in ROS generation and elimination (Sies2015). As research has advanced, oxidative stress is no longer viewed solely as a damaging state but as a perturbation of redox signaling. Moderate ROS levels act as signaling mediators in physiological regulation, whereas excessive ROS accumulation leads to cellular dysfunction and disease (Jones2006; Ray et al.2012; Reybrouck2014). Here, we demonstrated that cisplatin or radiation, classical inducers of oxidative stress in tumors, can drive macrophages into durable cell cycle arrest, and that these SA‐β‐Gal+senescent macrophages display unique biological behaviors. As a universal feature of cellular senescence, the SASP promotes inflammation, infections, and malignancies through proinflammatory cytokines, CXC chemokine ligands, and extracellular matrix proteases (Mosteiro et al.2016). Consistent with previous reports, we observed that oxidative stress–induced senescent macrophages exhibit high IL‐1β secretion. SASP has indeed been identified as an early marker of cellular senescence (Coppé et al.2008; Young and Narita2009). Our data further showed that GLS2 enhances IL‐1β secretion via endogenous glutamine metabolism, and that inhibiting GLS2 significantly reduces IL‐1β release in senescent macrophages. These results indicate that IL‐1β expression is upregulated by GLS2‐mediated glutamine metabolism and that GLS2 activity represents an early event in the secretory phenotype of senescent macrophages.
Glutamine and glucose are the two major consumable nutrients for tumor cells, supporting energy metabolism, anabolic activity, and redox homeostasis, respectively (Wise and Thompson2010; Altman et al.2016). Under oxidative stress, glutamine assumes additional roles linked to its function as a carbon–nitrogen hub. As a precursor of GSH and a promotor of NADPH generation, it removes ROS and maintains redox balance, thereby providing tumor cells with survival and invasive advantages during elevated oxidative stress (Gong et al.2022; Fan et al.2024). Consequently, certain tumor cells develop glutamine addiction, a hallmark of metabolic reprogramming in cancer (Hensley et al.2013). Glutamine addiction indicates that tumor cells remain dependent on glutamine despite abundant nutrient availability (Wise and Thompson2010). During tumor invasion and metastasis, ROS act as signaling molecules that activate EMT (Radisky et al.2005; Pan et al.2012); however, excessive ROS cause cell death; tumor cells therefore rely on glutamine metabolism to buffer ROS via NADPH and GSH production, sustaining invasion and metastasis under moderate ROS conditions (Hensley et al.2013; Trachootham et al.2009; Son et al.2013). According to Zou et al., glutamine metabolism maintains redox homeostasis through these mechanisms, forming a metabolic foundation for glutamine addiction in aggressive tumors (Zou et al.2025).
In our study, oxidative stress–induced senescent macrophages exhibited elevated glutamine metabolism, which facilitated SCC invasion. This finding suggests that glutamine metabolism may fuel this invasive process and raises the possibility that SCC is glutamine addicted, offering a potential direction for metabolic targeting therapy. Among therapeutic strategies for glutamine‐addicted tumors, GLS inhibition remains a well‐established approach. Telaglenastat (CB‐839), a representative glutaminase inhibitor, has undergone Phase I/II cancer trials and is well tolerated by patients (Wicker et al.2021). However, the CANTATA randomized clinical trial reported that combining CB‐839 with cabozantinib in patients with mRCC did not improve progression‐free survival or overall survival (Tannir et al.2022). Our data also demonstrated that pharmacological IL‐1β inhibition, when combined with GLS2 blockade, produced a significant invasive promotion, suggesting that GLS2‐mediated glutamine metabolism and/or its metabolites may directly suppress invasiveness. Similar paradoxical roles for GLS2 have been reported in breast and liver cancers (Suzuki et al.2022; Dias et al.2020), reinforcing the view that GLS2 functions are cell‐ and tissue‐specific.
These findings suggest that GLS2 inhibition may not effectively suppress tumor progression due to metabolic plasticity and context‐dependent responses. In contrast, targeting downstream inflammatory mediators such as IL‐1β might bypass these adaptive mechanisms and provide a more stable and direct anti‐invasive effect. Therefore, rather than representing a contradiction, our results underscore the complexity of metabolic‐inflammatory crosstalk and highlight the importance of selecting therapeutically actionable nodes within this regulatory network. Similarly, Opitz et al. found that therapeutically targeting aryl hydrocarbon receptor, which is the critical downstream receptor of kynurenine pathway signaling, could counteract the compensatory effect of indoleamine 2,3‐dioxygenase/tryptophan 2,3‐dioxygenase in tryptophan‐mediated tumor immunosuppression (Opitz et al.2011), demonstrating that therapeutically targetable pathways do not necessarily represent primary mechanistic drivers.
As a key proinflammatory cytokine, IL‐1β exerts its biological functions by binding to its downstream high‐affinity receptors, particularly IL‐1R1 and IL‐1R2 (van Baarle et al.2024). IL‐1R2 known as a decoy receptor, competitively binds and sequesters IL‐1β but lacks the intracellular toll/interleukin‐1 receptor (TIR) domain required for IL‐1β signal transduction (Gaballa et al.2024). Our in vitro and in vivo findings showed that senescent macrophages downregulated IL‐1R2 expression in head and neck squamous cell carcinoma (HNSCC) cells without affecting IL‐1R1 levels. Consistent with this observation, injection of an IL‐1β inhibitor gel significantly increased IL‐1R2 expression in mice bearing HNSCC tumors derived from SCC‐7 cells and senescent macrophages, whereas IL‐1R1 levels remained unchanged. These findings suggest that senescent macrophage‐derived IL‐1β reduces IL‐1R2 expression and activates the IL‐R1 signaling cascade in cancer cells. Intriguingly, our results demonstrated that senescent macrophages strongly promoted cellular invasion while suppressing tumor cell proliferation. In contrast, senescent alveolar macrophages have been reported to enhance Ki‐67 expression and malignant progression by creating an immunosuppressive microenvironment in premalignant lung tumors (Haston et al.2023). In our study, cisplatin‐ or radiation‐induced senescent macrophages increased p21 expression in cancer cells, thereby blocking the transition from G1 to G2/S and inhibiting proliferation via the IL‐1β/IL‐1R2/p21 signaling cascade. These findings indicate that senescent macrophages can act as tumor‐initiating events yet exhibit paradoxical roles in regulating proliferation. Notably, pathways controlling proliferation and invasion are not always linked. IL‐1β binds IL‐1R1, leading to NF‐κB activation that promotes cancer invasion (Yang et al.2026). Supporting this mechanism, we analyzed the NF‐κB signaling state of p65 and pp65 in cytoplasmic fractions and found that senescent macrophage‐derived IL‐1β increased both p65 and pp65 expression, thereby promoting SCC invasion through the IL‐1β/IL‐1R2/NF‐κB pathway. This raises the question of how cancer cells meet the energy demands required for invasion. Due to aerobic glycolysis, or the Warburg effect, cancer cells increasingly rely on glycolysis rather than oxidative phosphorylation to satisfy energy needs (Fendt2024). As expected, we found that inhibiting glutamine metabolism with C‐IN‐1 activated aerobic glycolysis as a positive feedback mechanism supporting aggressive oral cancer.
In addition to the mechanistic insights described above, it is important to consider the experimental context in which these findings were obtained. In this study,p16−/−mice were used to establish a host environment with a reduced endogenous senescent cell burden, thereby minimizing background interference and enabling a clearer evaluation of the effects of exogenously introduced senescent macrophages. Importantly, all experimental groups were maintained within the same p16‐deficient background, ensuring that systemic effects of p16 loss were consistent across groups. As SCC‐7 tumor cells were exogenously implanted and do not carry p16 deficiency, the observed phenotypes are more likely attributable to the functional impact of senescent macrophages rather than direct alterations in tumor cell‐intrinsic cell cycle regulation. Nevertheless, it should be noted that the use of global p16−/− mice may introduce systemic effects across multiple cell types, which could influence the tumor microenvironment. Within this framework, our findings further support a central role for SASP‐mediated signaling in regulating tumor progression.
It is important to note that the SASP is regarded as the most prominent feature of cellular senescence, and the NF‐κB pathway serves as the major regulatory mechanism controlling SASP production (Strzeszewska et al.2018; Luo et al.2025). Mechanistically, mTOR can upregulate IL‐1α expression, thereby activating NF‐κB signaling to promote translation of SASP mRNAs (Orjalo et al.2009). Our findings also demonstrated that the NF‐κB cascade in cancer cells functions as a downstream effector activated by SASP within the surrounding microenvironment. Rapamycin exerts significant anti‐SASP effects, and its combination with mTOR inhibitors can reverse senescent transition in presenescent cells (Laberge et al.2015; Walters et al.2016). However, rapamycin use in clinical settings may cause adverse effects, including immunosuppression, impaired glucose tolerance, and lipid abnormalities (Blättler et al.2012; Trelinska et al.2015). To this end, the compound DL001, as a novel mTOR inhibitor, has shown markedly greater selectivity toward mTORC1 than rapamycin (Schreiber et al.2019). Given that the dual tumor‐modulatory roles of senescent cells highly depend heavily on SASP heterogeneity, preserving tumor‐suppressive SASP components while inhibiting tumor‐promotive SASP remains essential. Therefore, elucidating the signaling pathways that regulate tumor‐promotive SASP and developing strategies to block these pathways are urgently needed.
Collectively, our work highlights the critical role of senescent macrophages in promoting cancer invasion through glutamine metabolism. We identify a mechanism by which GLS2‐dependent IL‐1β secretion from senescent macrophages influences glutamine metabolism in cancer cells in an IL‐1R2‐dependent manner. Importantly, targeting IL‐1β was more effective in suppressing cancer invasion than GLS2 inhibition. These findings reveal a previously unrecognized metabolism linking glutamine metabolism and the SASP through senescent macrophages and propose a potential metabolic intervention strategy to counteract SCC invasion.
Author Contributions
H.Z., F.W., and J.L. contributed to the conception, and designed the experiments and supervised the project. S.W., J.M., and J.L. carried out the experiments, analyzed the data and wrote the manuscript. W.Z. and C.H. helped to collect the human samples and performed the experiments. X.S. helped to analyze the data. H.Z., F.W., J.L., S.W., and J.M. discussed and edited paper. All authors approved the manuscript.
Funding
This study was supported by grants from the National Key Research and Development Program of China 2023YFC3605600 (F.W.), the National Natural Science Foundation of China 82370963 (F.W.), 82573832 (H.Z.), 82301094 (S.W.), and 82301095 (X.S.), and the Sichuan Science and Technology Program 2026NSFSC0673 (F.W.).
Disclosure
Generative AI and AI‐assisted technologies were not used in the preparation of this work.
Ethics Statement
This study strictly adhered to all relevant ethical guidelines and regulations. Clinical data and human tissue samples were collected in compliance with the Ethics Committee of the West China Hospital of Stomatology, Sichuan University (No. WCHSIRB‐D‐2019‐012, No. WCHSIRB‐D‐2020‐073, and No. WCHSIRB‐D‐2023‐203).
Conflicts of Interest
The authors declare no conflicts of interest.
References
- Altman, B. J. , Z. E. Stine, andC. V. Dang. 2016. “From Krebs to Clinic: Glutamine Metabolism to Cancer Therapy. ”Nature Reviews. Cancer16: 619–634. doi.org/10.1038/nrc.2016.71
- Assouline, B. , R. Kahn, L. Hodali, et al. 2024. “Senescent Cancer‐Associated Fibroblasts in Pancreatic Adenocarcinoma Restrict CD8(+) T Cell Activation and Limit Responsiveness to Immunotherapy in Mice. ”Nature Communications15: 6162. doi.org/10.1038/s41467-024-50441-7
- Blättler, S. M. , J. T. Cunningham, F. Verdeguer, et al. 2012. “Yin Yang 1 Deficiency in Skeletal Muscle Protects Against Rapamycin‐Induced Diabetic‐Like Symptoms Through Activation of Insulin/IGF Signaling. ”Cell Metabolism15: 505–517. doi.org/10.1016/j.cmet.2012.03.008
- Cluntun, A. A. , M. J. Lukey, R. A. Cerione, andJ. W. Locasale. 2017. “Glutamine Metabolism in Cancer: Understanding the Heterogeneity. ”Trends Cancer3: 169–180. doi.org/10.1016/j.trecan.2017.01.005
- Coppé, J. P. , C. K. Patil, F. Rodier, et al. 2008. “Senescence‐Associated Secretory Phenotypes Reveal Cell‐Nonautonomous Functions of Oncogenic RAS and the p53 Tumor Suppressor. ”PLoS Biology6: 2853–2868. doi.org/10.1371/journal.pbio.0060301
- D'Ambrosio, M. , andJ. Gil. 2023. “Reshaping of the Tumor Microenvironment by Cellular Senescence: An Opportunity for Senotherapies. ”Developmental Cell58: 1007–1021. doi.org/10.1016/j.devcel.2023.05.010
- Danish, M. , B. Diwan, A. Kumar, et al. 2025. “Comparative Evaluation of Cellular Senescence in Naturally Aged and Stress‐Induced Murine Macrophages for Identifying Optimum Senescent Macrophage Study Systems. ”Molecular Biology Reports52: 123. doi.org/10.1007/s11033-025-10232-9
- Dias, M. M. , D. Adamoski, L. M. Dos Reis, et al. 2020. “GLS2 Is Protumorigenic in Breast Cancers. ”Oncogene39: 690–702. doi.org/10.1038/s41388-019-1007-z
- Dong, Z. , Y. Luo, Z. Yuan, Y. Tian, T. Jin, andF. Xu. 2024. “Cellular Senescence and SASP in Tumor Progression and Therapeutic Opportunities. ”Molecular Cancer23: 181. doi.org/10.1186/s12943-024-02096-7
- Duan, Z. , andY. Luo. 2021. “Targeting Macrophages in Cancer Immunotherapy. ”Signal Transduction and Targeted Therapy6: 127. doi.org/10.1038/s41392-021-00506-6
- Fan, Y. , H. Xue, Z. Li, M. Huo, H. Gao, andX. Guan. 2024. “Exploiting the Achilles' Heel of Cancer: Disrupting Glutamine Metabolism for Effective Cancer Treatment. ”Frontiers in Pharmacology15: 1345522. doi.org/10.3389/fphar.2024.1345522
- Fendt, S. M. 2024. “100 Years of the Warburg Effect: A Cancer Metabolism Endeavor. ”Cell187: 3824–3828. doi.org/10.1016/j.cell.2024.06.026
- Gaballa, J. M. , J. F. Højen, D. M. De Graaf, J. Amo‐Aparicio, C. Marchetti, andG. e. al Cavalli. 2024. “International Nomenclature Guidelines for the IL‐1 Family of Cytokines and Receptors. ”Nature Immunology25: 581–582. doi.org/10.1038/s41590-024-01777-1
- Gerstberger, S. , Q. Jiang, andK. Ganesh. 2023. “Metastasis. ”Cell186: 1564–1579. doi.org/10.1016/j.cell.2023.03.003
- Glaviano, A. , H. S. Lau, L. M. Carter, et al. 2025. “Harnessing the Tumor Microenvironment: Targeted Cancer Therapies Through Modulation of Epithelial‐Mesenchymal Transition. ”Journal of Hematology & Oncology18: 6. doi.org/10.1186/s13045-024-01634-6
- Gomez, K. E. , F. Wu, S. B. Keysar, et al. 2020. “Cancer Cell CD44 Mediates Macrophage/Monocyte‐Driven Regulation of Head and Neck Cancer Stem Cells. ”Cancer Research80: 4185–4198. doi.org/10.1158/0008-5472.CAN-20-1079
- Gong, T. , C. Zheng, X. Ou, et al. 2022. “Glutamine Metabolism in Cancers: Targeting the Oxidative Homeostasis. ”Frontiers in Oncology12: 994672. doi.org/10.3389/fonc.2022.994672
- Graham, T. A. , andD. Shibata. 2020. “Navigating the Path to Distant Metastasis. ”Nature Genetics52: 642–643. doi.org/10.1038/s41588-020-0660-z
- Guerrero, P. , C. Bono, M. Sobén, et al. 2024. “GM‐CSF Receptor Expression Determines Opposing Innate Memory Phenotypes at Different Stages of Myelopoiesis. ”Blood143: 2763–2777. doi.org/10.1182/blood.2024024330
- Hanahan, D. 2022. “Hallmarks of Cancer: New Dimensions. ”Cancer Discovery12: 31–46. doi.org/10.1158/2159-8290.CD-21-1059
- Haston, S. , E. Gonzalez‐Gualda, S. Morsli, et al. 2023. “Clearance of Senescent Macrophages Ameliorates Tumorigenesis in KRAS‐Driven Lung Cancer. ”Cancer Cell41: 1242–1260. e1246. doi.org/10.1016/j.ccell.2023.05.004
- Hensley, C. T. , A. T. Wasti, andR. J. DeBerardinis. 2013. “Glutamine and Cancer: Cell Biology, Physiology, and Clinical Opportunities. ”Journal of Clinical Investigation123: 3678–3684. doi.org/10.1172/JCI69600
- Herranz, N. , andJ. Gil. 2018. “Mechanisms and Functions of Cellular Senescence. ”Journal of Clinical Investigation128: 1238–1246. doi.org/10.1172/JCI95148
- Hu, X. , Z. Ma, B. Xu, et al. 2023. “Glutamine Metabolic Microenvironment Drives M2 Macrophage Polarization to Mediate Trastuzumab Resistance in HER2‐Positive Gastric Cancer. ”Cancer Commun (Lond)43: 909–937. doi.org/10.1002/cac2.12459
- Jin, L. , G. N. Alesi, andS. Kang. 2016. “Glutaminolysis as a Target for Cancer Therapy. ”Oncogene35: 3619–3625. doi.org/10.1038/onc.2015.447
- Jones, D. P. 2006. “Redefining Oxidative Stress. ”Antioxidants & Redox Signaling8: 1865–1879. doi.org/10.1089/ars.2006.8.1865
- Kaur, P. , S. Verma, P. P. Kushwaha, andS. Gupta. 2023. “EZH2 and NF‐κB: A Context‐Dependent Crosstalk and Transcriptional Regulation in Cancer. ”Cancer Letters560: 216143. doi.org/10.1016/j.canlet.2023.216143
- Kloosterman, D. J. , andL. Akkari. 2023. “Macrophages at the Interface of the Co‐Evolving Cancer Ecosystem. ”Cell186: 1627–1651. doi.org/10.1016/j.cell.2023.02.020
- Kumar, S. , A. Nandi, S. Singh, et al. 2021. “Dll1(+) Quiescent Tumor Stem Cells Drive Chemoresistance in Breast Cancer Through NF‐κB Survival Pathway. ”Nature Communications12: 432. doi.org/10.1038/s41467-020-20664-5
- Kwa, S. M. , Z. Bai, andW. S. Toh. 2026. “Therapeutic Applications of Cell Membrane‐Coated Nanoparticles in Oral Diseases: Opportunities, Challenges, and Future Perspectives. ”Dental Research1, no. 1: 100007.
- Laberge, R. M. , Y. Sun, A. V. Orjalo, et al. 2015. “MTOR Regulates the Pro‐Tumorigenic Senescence‐Associated Secretory Phenotype by Promoting IL1A Translation. ”Nature Cell Biology17: 1049–1061. doi.org/10.1038/ncb3195
- Lee, B. Y. , J. A. Han, J. S. Im, et al. 2006. “Senescence‐Associated Beta‐Galactosidase Is Lysosomal Beta‐Galactosidase. ”Aging Cell5: 187–195. doi.org/10.1111/j.1474-9726.2006.00199.x
- Li, B. , Y. Cui, D. K. Nambiar, J. B. Sunwoo, andR. Li. 2019. “The Immune Subtypes and Landscape of Squamous Cell Carcinoma. ”Clinical Cancer Research25: 3528–3537. doi.org/10.1158/1078-0432.CCR-18-4085
- Liebold, I. , A. Al Jawazneh, C. Casar, et al. 2024. “Apoptotic Cell Identity Induces Distinct Functional Responses to IL‐4 in Efferocytic Macrophages. ”Science384: eabo7027. doi.org/10.1126/science.abo7027
- Luo, J. , T. Sun, Z. Liu, et al. 2025. “Persistent Accumulation of Therapy‐Induced Senescent Cells: An Obstacle to Long‐Term Cancer Treatment Efficacy. ”International Journal of Oral Science17: 59. doi.org/10.1038/s41368-025-00380-w
- Ma, G. , Z. Zhang, P. Li, et al. 2022. “Reprogramming of Glutamine Metabolism and Its Impact on Immune Response in the Tumor Microenvironment. ”Cell Communication and Signaling: CCS20: 114. doi.org/10.1186/s12964-022-00909-0
- Mori, J. O. , I. Elhussin, W. N. Brennen, et al. 2024. “Prognostic and Therapeutic Potential of Senescent Stromal Fibroblasts in Prostate Cancer. ”Nature Reviews. Urology21: 258–273. doi.org/10.1038/s41585-023-00827-x
- Mosteiro, L. , C. Pantoja, N. Alcazar, et al. 2016. “Tissue Damage and Senescence Provide Critical Signals for Cellular Reprogramming In Vivo. ”Science354, no. 6315: aaf4445. doi.org/10.1126/science.aaf4445
- Muñoz‐Espín, D. , andM. Serrano. 2014. “Cellular Senescence: From Physiology to Pathology. ”Nature Reviews. Molecular Cell Biology15: 482–496. doi.org/10.1038/nrm3823
- Opitz, C. A. , U. M. Litzenburger, F. Sahm, et al. 2011. “An Endogenous Tumour‐Promoting Ligand of the Human Aryl Hydrocarbon Receptor. ”Nature478: 197–203. doi.org/10.1038/nature10491
- Orjalo, A. V. , D. Bhaumik, B. K. Gengler, G. K. Scott, andJ. Campisi. 2009. “Cell Surface‐Bound IL‐1alpha Is an Upstream Regulator of the Senescence‐Associated IL‐6/IL‐8 Cytokine Network. ”Proceedings of the National Academy of Sciences of the United States of America106: 17031–17036. doi.org/10.1073/pnas.0905299106
- Pan, S. , S. Giri, andP. K. Chattaraj. 2012. “A Computational Study on the Hydrogen Adsorption Capacity of Various Lithium‐Doped Boron Hydrides. ”Journal of Computational Chemistry33: 425–434. doi.org/10.1002/jcc.21985
- Petrova, N. V. , A. K. Velichko, S. V. Razin, andO. L. Kantidze. 2016. “Small Molecule Compounds That Induce Cellular Senescence. ”Aging Cell15: 999–1017. doi.org/10.1111/acel.12518
- Prieto, L. I. , I. Sturmlechner, S. I. Graves, et al. 2023. “Senescent Alveolar Macrophages Promote Early‐Stage Lung Tumorigenesis. ”Cancer Cell41: 1261–1275. doi.org/10.1016/j.ccell.2023.05.006
- Quek, L. E. , M. van Geldermalsen, Y. F. Guan, et al. 2022. “Glutamine Addiction Promotes Glucose Oxidation in Triple‐Negative Breast Cancer. ”Oncogene41: 4066–4078. doi.org/10.1038/s41388-022-02408-5
- Radisky, D. C. , D. D. Levy, L. E. Littlepage, et al. 2005. “Rac1b and Reactive Oxygen Species Mediate MMP‐3‐Induced EMT and Genomic Instability. ”Nature436: 123–127. doi.org/10.1038/nature03688
- Ray, P. D. , B. W. Huang, andY. Tsuji. 2012. “Reactive Oxygen Species (ROS) Homeostasis and Redox Regulation in Cellular Signaling. ”Cellular Signalling24: 981–990. doi.org/10.1016/j.cellsig.2012.01.008
- Reybrouck, M. 2014. “Music as Environment: An Ecological and Biosemiotic Approach. ”Behav Sci (Basel)5: 1–26. doi.org/10.3390/bs5010001
- Schreiber, K. H. , S. I. Arriola Apelo, D. Yu, et al. 2019. “A Novel Rapamycin Analog Is Highly Selective for mTORC1 In Vivo. ”Nature Communications10: 3194. doi.org/10.1038/s41467-019-11174-0
- Sies, H. 2015. “Oxidative Stress: A Concept in Redox Biology and Medicine. ”Redox Biology4: 180–183. doi.org/10.1016/j.redox.2015.01.002
- Son, J. , C. A. Lyssiotis, H. Ying, et al. 2013. “Glutamine Supports Pancreatic Cancer Growth Through a KRAS‐Regulated Metabolic Pathway. ”Nature496: 101–105. doi.org/10.1038/nature12040
- Strzeszewska, A. , O. Alster, G. Mosieniak, A. Ciolko, andE. Sikora. 2018. “Insight Into the Role of PIKK Family Members and NF‐кB in DNAdamage‐Induced Senescence and Senescence‐Associated Secretory Phenotype of Colon Cancer Cells. ”Cell Death & Disease9: 44. doi.org/10.1038/s41419-017-0069-5
- Suzuki, S. , D. Venkatesh, H. Kanda, et al. 2022. “GLS2 Is a Tumor Suppressor and a Regulator of Ferroptosis in Hepatocellular Carcinoma. ”Cancer Research82: 3209–3222. doi.org/10.1158/0008-5472.CAN-21-3914
- Tannir, N. M. , N. Agarwal, C. Porta, et al. 2022. “Efficacy and Safety of Telaglenastat Plus Cabozantinib vs Placebo Plus Cabozantinib in Patients With Advanced Renal Cell Carcinoma: The CANTATA Randomized Clinical Trial. ”JAMA Oncology8: 1411–1418. doi.org/10.1001/jamaoncol.2022.3511
- Tian, H. , R. Lian, Y. Li, et al. 2020. “AKT‐Induced lncRNA VAL Promotes EMT‐Independent Metastasis Through Diminishing Trim16‐Dependent Vimentin Degradation. ”Nature Communications11: 5127. doi.org/10.1038/s41467-020-18929-0
- Trachootham, D. , J. Alexandre, andP. Huang. 2009. “Targeting Cancer Cells by ROS‐Mediated Mechanisms: A Radical Therapeutic Approach?”Nature Reviews. Drug Discovery8: 579–591. doi.org/10.1038/nrd2803
- Trelinska, J. , I. Dachowska, K. Kotulska, W. Fendler, S. Jozwiak, andW. Mlynarski. 2015. “Complications of Mammalian Target of Rapamycin Inhibitor Anticancer Treatment Among Patients With Tuberous Sclerosis Complex Are Common and Occasionally Life‐Threatening. ”Anti‐Cancer Drugs26: 437–442. doi.org/10.1097/CAD.0000000000000207
- van Baarle, L. , V. De Simone, L. Schneider, et al. 2024. “IL‐1R Signaling Drives Enteric Glia‐Macrophage Interactions in Colorectal Cancer. ”Nature Communications15: 6079. doi.org/10.1038/s41467-024-50438-2
- Walters, H. 2023. “Senescent Macrophages Drive Lung Cancer and Accumulate in Aging. ”Nat Aging3: 757. doi.org/10.1038/s43587-023-00459-1
- Walters, H. E. , S. Deneka‐Hannemann, andL. S. Cox. 2016. “Reversal of Phenotypes of Cellular Senescence by Pan‐mTOR Inhibition. ”Aging (Albany NY)8: 231–244. doi.org/10.18632/aging.100872
- Wang, P. , J. Geng, J. Gao, et al. 2019. “Macrophage Achieves Self‐Protection Against Oxidative Stress‐Induced Ageing Through the Mst‐Nrf2 Axis. ”Nature Communications10: 755. doi.org/10.1038/s41467-019-08680-6
- Wicker, C. A. , B. G. Hunt, S. Krishnan, et al. 2021. “Glutaminase Inhibition With Telaglenastat (CB‐839) Improves Treatment Response in Combination With Ionizing Radiation in Head and Neck Squamous Cell Carcinoma Models. ”Cancer Letters502: 180–188. doi.org/10.1016/j.canlet.2020.12.038
- Wise, D. R. , andC. B. Thompson. 2010. “Glutamine Addiction: A New Therapeutic Target in Cancer. ”Trends in Biochemical Sciences35: 427–433. doi.org/10.1016/j.tibs.2010.05.003
- Wu, F. L. , K. Nolan, A. A. Strait, et al. 2019. “Macrophages Promote Growth of Squamous Cancer Independent of T Cells. ”Journal of Dental Research98: 896–903. doi.org/10.1177/0022034519854734
- Yan, W. , I. I. Wistuba, M. R. Emmert‐Buck, andH. S. Erickson. 2011. “Squamous Cell Carcinoma ‐ Similarities and Differences Among Anatomical Sites. ”American Journal of Cancer Research1: 275–300.
- Yang, J. , S. Wang, X. Li, et al. 2026. “Signaling Pathways and Targeted Interventions for Precancers. ”Signal Transduction and Targeted Therapy11: 9. doi.org/10.1038/s41392-025-02342-4
- Young, A. R. , andM. Narita. 2009. “SASP Reflects Senescence. ”EMBO Reports10: 228–230. doi.org/10.1038/embor.2009.22
- Zhang, M. , L. Zhang, R. Hei, et al. 2021. “CDK Inhibitors in Cancer Therapy, an Overview of Recent Development. ”American Journal of Cancer Research11: 1913–1935.
- Zheng, H. , Y. Q. Li, X. Lu, et al. 2025. “Senescent SPP1(+) Macrophages Remodel the Tumor Microenvironment and Promote the Progression of Early‐Stage Lung Adenocarcinoma Featured With Mixed Ground Glass Nodule. ”Molecular Cancer24: 298. doi.org/10.1186/s12943-025-02497-2
- Zou, W. , Z. Han, Z. Wang, andQ. Liu. 2025. “Targeting Glutamine Metabolism as a Potential Target for Cancer Treatment. ”Journal of Experimental & Clinical Cancer Research44: 180. doi.org/10.1186/s13046-025-03430-7
Republished from the open web under CC-BY. Authors: Wang S, Mu J, Zhao W, Hu C, Shi X, Zhou H, Liu J, Wu F. Read the original.