Phenylalanine Versus Tyrosine (Pos. 367/332 in MCT1/MCT4) in the Substrate Binding Site Defines Affinity and Preferred Directionality of Human Monocarboxylate Transporters 1-4.
Aim Human monocarboxylate transporters 1-4, MCT, are key for the lactate/H + exchange between glycolytic and oxidative cancer cells, white and red muscle fibers, or in the astrocyte-neuron shuttle. The common MCT transport mechanism involves three conserved residues, that is, a substrate-attracting Lys and a conformation-locking Asp/Arg salt bridge (positions 38 and 309/313 in MCT1). Yet, it remained unclear which sites define isoform-specific substrate affinity and preferred transport directionality. Methods Here, we analyzed structural differences in the binding sites of MCT1-4 and determined their impact on the biophysical transport properties and inhibitor binding using radiolabeled transport assays in yeast. Results We found differences in amino acid positions with sidechain hydroxyl groups. While the higher affinity MCT1 and MCT2 carry Phe/Ser-OH (pos. 367/371 in MCT1), the lower affinity MCT3 and MCT4 have Tyr-OH/Gly. Mutation of Phe/Ser-OH in MCT1 to Tyr-OH/Gly markedly decreased the affinity for lactate and pyruvate, while it did not change the affinity for propionate. The maximal transport velocity increased with decreasing affinity, and the preferred transport directionality shifted toward export. Likewise, replacing Met151 by Ala shifted transport bias possibly by eliminating conformation-stabilizing sulfur-aromatic interactions. Moreover, these mutations lowered the activity of the clinical candidate MCT1 inhibitor AZD3965 by three orders of magnitude providing insight into the molecular drug binding mode and explaining the strong preference for MCT1 over MCT4. Conclusions Together, subtle changes in the arrangement of sidechains in the MCT binding site determine basic monocarboxylate/H + transport properties that impact lactate-related physiology, namely cellular metabolism, reprogramming, and signaling.
Introduction
Lactate, long thought to be solely a waste product derived under hypoxic metabolic conditions, has gained attention as a key metabolite and signaling molecule in health and disease [1,2,3]. A century ago, cellular secretion of lactate despite sufficiently supplied oxygen was found to be a trait of tumorous tissues [4], now termed the Warburg effect. Warburg cells derive energy from the less efficient glycolysis pathway rather than from oxidative phosphorylation. Ample amounts of lactate generated during the process must be secreted in order to maintain glycolysis and prevent toxic cellular acidification [5]. Later, an interplay with neighboring tumor cells undergoing oxidative phosphorylation was described [6,7]. Such cells profit from the uptake of lactate, followed by oxidation to pyruvate, which can then be metabolized in the citric acid cycle. Today, lactate shuttling between producing glycolytic cells and consuming oxidative cells is seen as a fundamental principle in the physiology of for example, muscle (from white to red muscle fibers) and brain (astrocyte‐neuron shuttle) [8,9].
The directionality of lactate use and production is governed by the associated cellular metabolism. The resulting transmembrane gradients and pH conditions determine the kinetics of involved transport proteins. Mainly four monocarboxylate transporters, MCT1–4, from the solute carrier family SLC16A facilitate proton‐coupled transmembrane lactate transport in humans [10]. Besides the prevailing gradients, protein properties such as substrate affinity and transfer mechanics of the MCT isoform determine the velocity and preferred directionality of transport. MCTs operate by an alternating access mechanism that switches between outward‐open and inward‐open conformations upon substrate/H+binding [11]. A conserved motif of three charged amino acids, Lys38, Asp309, and Arg313 (MCT1 numbering; Figure1A), was found to be essential for transport functionality [11,12]. According to the current view [13], the positively charged Lys38 attracts the lactate anion. After binding, lactate itself transfers a proton from Lys38 to the Asp309/Arg313 salt bridge. Breakage of the salt bridge initiates the conformational change, releasing the lactate and the proton in a 1:1 stoichiometry on thetransside.
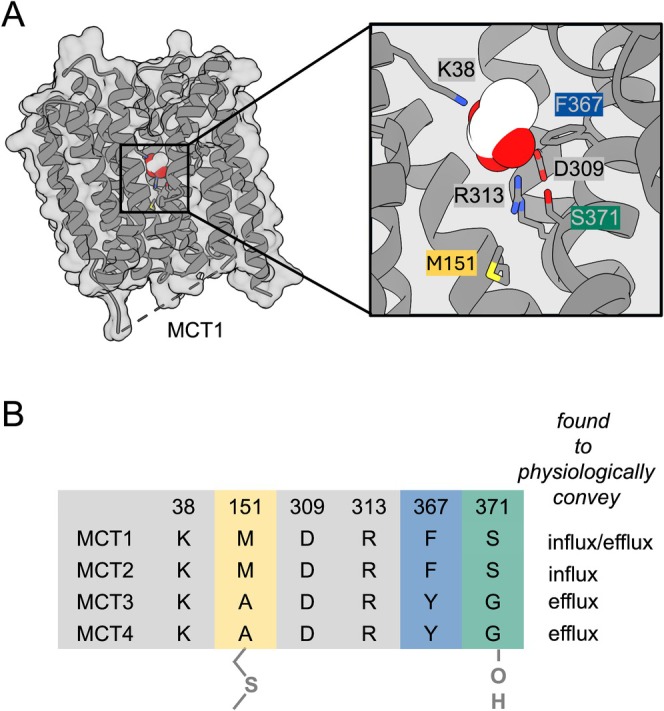
Structural differences in lactate transporting MCT1‐4. (A) The MCT1 protein structure (PDB# 6LZ0) is depicted with a focus on residues of the lactate binding site. Deviating sites between MCT1/2 and MCT3/4 are colored. (B) Amino acid composition of the lactate binding sites of MCT1‐4 with MCT1 numbering.
Although MCT1–4 most presumably share this transport mechanism [12], in a physiological setting, the MCT isoforms exhibit differences regarding their preference for lactate import or export (Figure1B). This depends in part on the presence and state of transport‐supporting proteins such as basigin [14,15], a transmembrane protease [16,17], and carbonic anhydrases [18,19]. According the principles of thermodynamics, a secondary active transport system can maximally reach even concentrations of substrate on either side of the membrane [20]. The inward and outward transport velocities of a transporter can differ, which we term here preferred directionality. An MCT protein‐internal property affecting the preferred transport directionality is the isoform‐specific lactate binding affinity (Figure1B) [21]. The almost ubiquitously expressed MCT1 exhibits lactate affinity in the range of the physiological lactate concentration (Km3–5 mM), and mediates both, import and export. High‐affinity MCT2 is predominantly found in tissues that depend on the uptake of lactate as a gluconeogenic precursor (e.g., liver parenchymal cells) or to fuel mitochondrial respiration (e.g., neurons). The apparentKmof MCT2 for lactate of 0.7 mM is below the typical extracellular lactate concentration ensuring a constant import rate [22]. MCT3 and MCT4, in turn, were found in tissues relying on lactate export. Low lactate affinity would enable export into high‐lactate environments [23]. However, earlier measurements of MCT4 inXenopus laevisoocytes yielding aKmof 28–35 mM [23,24] were recently challenged. Using heterologous MCT4 expression in human HEK293, MDA‐MB‐231 cells, and macrophages revealed high lactate affinity (0.7–1.7 mM) [25]. The authors conducted mathematical modeling and claimed that even high lactate affinity would allow for lactate export into extracellular environments containing high lactate concentrations.
Variability in the observed transport properties of MCT1–4 is possibly due to the investigated cellular context, which prompted us to analyze the intrinsic structural properties of the MCT binding site and their role in defining transport kinetics. To avoid interference from metabolism and MCT‐modulating proteins, we usedSaccharomyces cerevisiaeyeast as a microbial, non‐lactate metabolizing model organism. Using radioactive14C labels and13C nuclear magnetic resonance of hyperpolarized tracers allowed us to investigate the transport mechanism for 30 min with a resolution of 5–10 min, and for 300 s with a resolution of seconds. The yeast system enabled largely background‐free determination of MCT transport kinetics from the seconds timeframe (initial rate,Km,vmax) into the establishment of the transmembrane lactate/H+equilibrium (kin/koutratio). We analyzed MCT1 variants with point mutations in the lactate binding site mimicking structural features of MCT4. A key finding was the exchange of Phe367 for Tyr in MCT1, that is, effectively adding a single hydroxyl group, alters the intrinsic transport properties to those of MCT4 in terms of substrate affinity, preferred transport directionality, and inhibitor binding.
Results
TheMCT1andMCT4Substrate Binding Sites Exhibit Different Arrangements of Hydroxyl Groups
Initially, we compared the amino acid sequences of MCT1–4 in the context of the resolved human MCT1 and MCT2 protein structures [26,27] to identify distinct amino acid residues in the substrate binding sites (Figures1BandS1). This revealed three positions that distinguish the higher affinity MCT1 and MCT2 (Met151, Phe367, Ser371; MCT1 numbering) from the putatively lower affinity MCT3 and MCT4 (Ala, Tyr, Gly) (Figure1B). Of these amino acid positions, Met151 may have a more structural role by defining the end of the binding site toward the cytoplasmic side. It had been previously implicated in contributing to the binding of the MCT1 inhibitor AZD3965 [26]. Phe367 and Ser371 are close to the bound monocarboxylate substrate and presumably make direct contact. An MCT1 variant carrying an F367Y mutation was generated before [26,28]. It reportedly lost the ability to transport pyruvate [26] and showed lower activity in lactate and oxoproline transport [28]. However, more in‐depth analyses are missing.
Yeast Cells Enable Equilibrium Studies in Transmembrane Lactate Transport
We expressed human MCT1 inS. cerevisiae(W303‐1A jen1Δ ady2Δ) lacking endogenous monocarboxylate transporters (FigureS2) [14,29]. Uptake of14C‐labeled lactate and pyruvate from 1 mM inward gradients was measured over a time span of 32 min (Figure2A). Background uptake by transmembrane diffusion was minimal in the used yeast strain and subtracted from uptake via MCT1. From the initial, rapid phase we determined transport rates of 0.12 ± 0.04 nmol mg−1min−1for lactate and 0.07 ± 0.02 nmol mg−1min−1for pyruvate. After about 15 min, lactate transport reached a transmembrane equilibrium at 0.67 ± 0.03 nmol lactate mg−1yeast (Figure2A). The apparent intracellular concentration of pyruvate continued to increase without arriving at a plateau (Figure2A).
![MCT1‐facilitated uptake and metabolism of lactate and pyruvate inS. cerevisiae. (A) Uptake curves of14C‐spiked pyruvate and lactate from 1 mM inward gradients indicate establishment of a transmembrane equilibrium for lactate transport after 15 min but not for pyruvate. Background transmembrane diffusion was minimal (dashed lines). (B) High resolution13C NMR spectroscopy of hyperpolarized [1–13C]‐pyruvate (170.5 ppm) showed rapid metabolic conversion to H13CO3−(160 ppm) and13CO2(125 ppm) with a mean rate constant of 3.02 ± 0.03 × 10⁻⁴s−1. Generally, the ratio of CO2/HCO3−depends on pH (here 5.7). No pyruvate to lactate conversion was observed. (C) High resolution13C NMR spectroscopy of hyperpolarized [1–13C]lactate (182.5 ppm) and its metabolic product [1–13C]pyruvate (170.5 ppm). The dynamics of the pyruvate signal were well‐fitted by a tri‐exponential decay function, indicating a net influx from lactate to the pyruvate pool with a rate constant of 1.39 ± 0.16 × 10⁻⁵s−1. The amount of lactate converted to pyruvate was (59 ± 8)‐times lower compared to the conversion of pyruvate to CO2/HCO3−within the same timeframe. SeeSupporting Informationfor details and the extracted kinetics.](https://pub-4f2af807d45642319f8e7f07a4c88770.r2.dev/PMC13265630/APHA-242-e70267-g008.jpg)
MCT1‐facilitated uptake and metabolism of lactate and pyruvate inS. cerevisiae. (A) Uptake curves of14C‐spiked pyruvate and lactate from 1 mM inward gradients indicate establishment of a transmembrane equilibrium for lactate transport after 15 min but not for pyruvate. Background transmembrane diffusion was minimal (dashed lines). (B) High resolution13C NMR spectroscopy of hyperpolarized [1–13C]‐pyruvate (170.5 ppm) showed rapid metabolic conversion to H13CO3−(160 ppm) and13CO2(125 ppm) with a mean rate constant of 3.02 ± 0.03 × 10⁻⁴s−1. Generally, the ratio of CO2/HCO3−depends on pH (here 5.7). No pyruvate to lactate conversion was observed. (C) High resolution13C NMR spectroscopy of hyperpolarized [1–13C]lactate (182.5 ppm) and its metabolic product [1–13C]pyruvate (170.5 ppm). The dynamics of the pyruvate signal were well‐fitted by a tri‐exponential decay function, indicating a net influx from lactate to the pyruvate pool with a rate constant of 1.39 ± 0.16 × 10⁻⁵s−1. The amount of lactate converted to pyruvate was (59 ± 8)‐times lower compared to the conversion of pyruvate to CO2/HCO3−within the same timeframe. SeeSupporting Informationfor details and the extracted kinetics.
We assumed that lactate would remain metabolically unaltered over the assay time, allowing for a transport equilibrium to establish, whereas pyruvate would be rapidly consumed by entering the energy metabolism. To test this directly, we followed up on the metabolic fate of pyruvate and lactate in yeast using hyperpolarized13C NMR spectroscopy (Figure2B,C). Hyperpolarization is a technique to magnetically label selected nuclei in various molecules so that the labeled nucleus can then be followed across metabolism with high temporal resolution, but only for a limited time [30,31]. Importantly, the resonance frequency of the nucleus (given in relative units, ppm) allows identifying the emitting molecule. When adding 56.4 mM hyperpolarized13C‐pyruvate to the yeast, we detected rapid metabolic conversion to hyperpolarized13CO2and H13CO3−(Figure2B). The pyruvate consumption rate per 1 billion cells was 3.02 ± 0.03 × 10⁻⁴s−1(FigureS3A), being affected by a combination of cellular uptake and metabolism. The addition of 20.8 mM hyperpolarized13C‐lactate (and some copolarized pyruvate) in turn showed only little metabolism as no other hyperpolarized13C‐metabolites were identified (Figure2C). Analyzing the pyruvate signal yielded a tri‐exponential decay, which indicated an influx from hyperpolarized lactate to hyperpolarized pyruvate with a conversion rate per 1 billion cells of 1.39 ± 0.16 × 10⁻⁵s−1(FigureS3B). Therefore, the lactate conversion was 59 ± 8‐times lower compared to pyruvate.
Extrapolating these results to a typical14C experiment, about 2.78% ± 0.03% and 0.13% ± 0.01% of 1 mM pyruvate and 1 mM lactate, respectively, would be consumed by 48 million cells in 32 min. Note that the reaction temperature in the13C experiment was 37°C, which may have led to faster transport and metabolism compared to the 19°C used in14C experiments.
Mutation ofMCT1Phe367 toMCT4‐Like Tyr Shifts Transport Equilibrium Toward Export
The position of the transport equilibrium,Keqequals the balanced ratio of the kinetic constants of inward and outward transport:Keq=kin/koutallowing one to conclude on the preferred transport directionality of the studied transporter (Figure3). In the case of lactate/H+transport via an MCT, the kinetic constants depend on the substrate and proton concentrations in the intra‐ and extracellular space, and on protein‐intrinsic properties, mainly substrate affinity (Km) and the maximal transport velocity (vmax). The equilibrium position, however, is independent of the number of transporters present at the plasma membrane. Therefore, direct comparisons of the transport capacities elicited by different MCT mutation constructs are valid even if their expression levels vary.
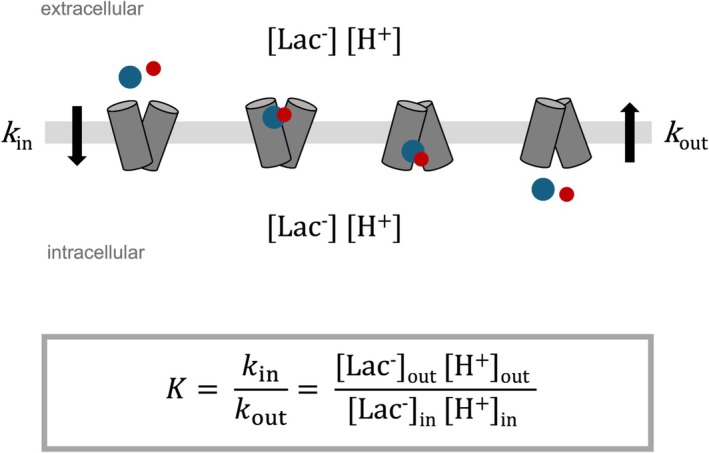
The transmembrane lactate equilibrium position depends on the pH gradient and protein intrinsic kinetic transport properties,kinandkout.
We generated five MCT1 mutants carrying either single (M151A, F367Y, S371G), double (F367Y/S371G), or triple mutations (M151A/F367Y/S371G) to mimic an MCT4‐like substrate binding site. All constructs were expressed in yeast (FigureS2). For the transport assays (Figure4A), an inward gradient of 1 mM lactate was used, and the external buffer pH was adjusted to the intracellular yeast pH of 6.8 to omit a transmembrane pH gradient. Of the five MCT1 mutants, only S371G displayed unaltered properties compared to wildtype MCT1 regarding the transport equilibrium position (Figure4B) and initial transport rate (Figure4C). The MCT1 F367Y mutation that adds a single hydroxyl group to the transporter protein decreased the intracellular lactate equilibrium concentration by 56% (Figure4B) and the initial velocity by 70% (Figure4C). With respect to the underlyingkin/kout‐ratio this means that the preferred transport directionality has about doubled toward export relative to the import direction. The joint mutation of F367Y with S371G showed the same decrease in intracellular lactate as F367Y alone (Figure4B), indicating that Phe367 is mainly responsible for the shift in the preferred transport directionality. MCT1 M151A showed a similar decrease (53%) as the F367Y mutation, and the combination as present in the triple mutant (M151A/F367Y/S371G) was additive, yielding an 80% lower intracellular lactate concentration (Figure4B).
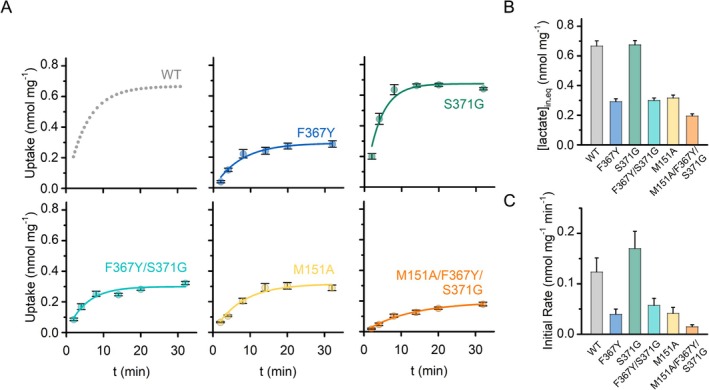
Lactate uptake into yeast via MCT1 wildtype (WT) and MCT1 mutants. (A) Uptake from 1 mM inward gradients at pH 6.8 were monitored for 32 min, and curves were fitted to an exponential‐rise‐to‐maximum function (r2≥ 0.94). Error bars denote SEM. (B) The intracellular lactate concentrations at transport equilibrium. (C) The bars depict initial lactate transport rates. Error bars denote the standard error of the fit.
To relate the observed shift in thekin/kout‐ratio to the Michaelis–Menten kinetics of the MCT1 variants, we determinedKmandvmaxfor each mutant (Figures5andS4). In line with an unchanged transport equilibrium position, MCT1 S371G showed no significant change inKm(5.3 mM) andvmax(0.71 mM) values, which were comparable to those of the wildtype. However, MCT1 F367Y decreased the lactate affinity more than 3 times (Kmto 17.8 mM). Concurrently,vmaxincreased 1.5 times to 1.08 nmol mg−1min−1. In the MCT1 F367Y/S371G double mutant, affinity was partly recovered (Km7.8 mM), whilevmaxremained high at 0.98 nmol mg−1min−1. In accordance with a structural role rather than direct substrate binding, the MCT1 M151A mutation did not significantly affect lactate affinity (Km6.1 mM) but strongly decreasedvmax(0.21 nmol mg−1min−1) possibly by interfering with the conformational flexibility of the protein during the transport cycle [26], and to its location close to the transporter hinge region [32].
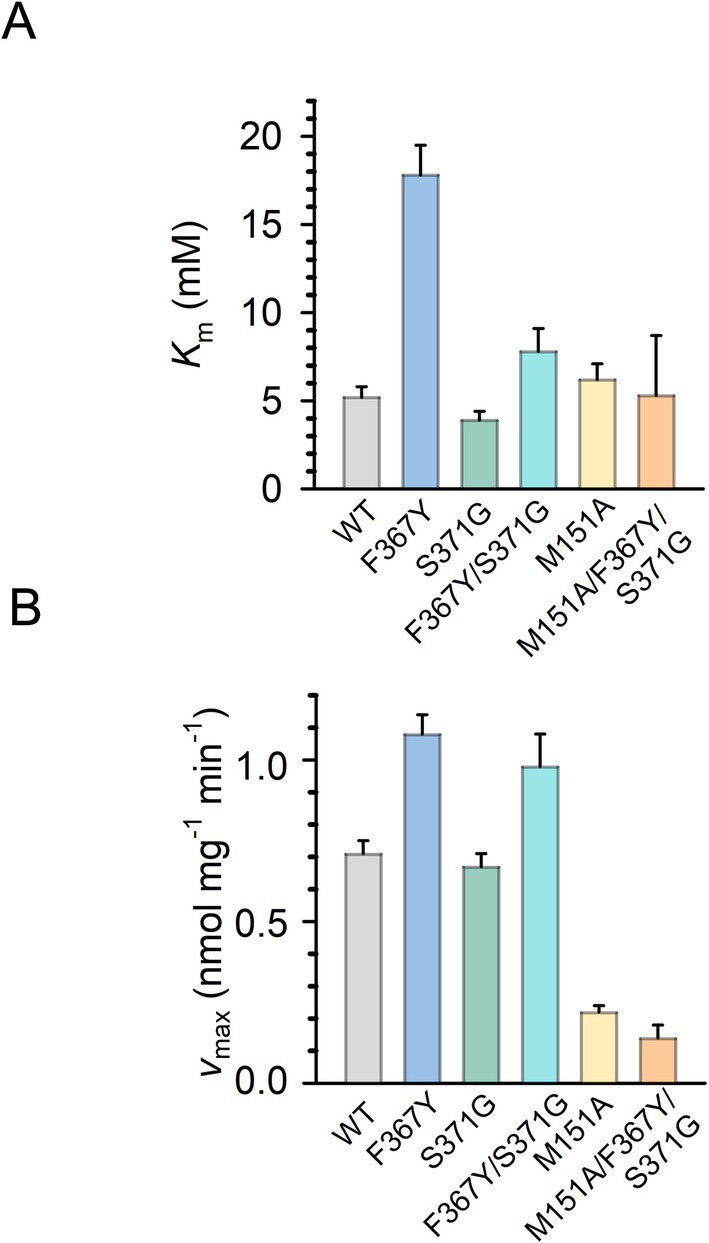
Michaelis–Menten kinetics of MCT1 wildtype (WT) and mutants. (A) Shown are the apparent lactate affinities expressed asKm. Higher values indicate lower affinity. (B) The bars depict the maximal transport velocity,vmax, Error bars denote SEM.
To complement the lactate uptake data, we assayed lactate transport via MCT1 wildtype, MCT1 F367Y, and MCT1 F367Y/S371G in the export direction (Figure6). Therefore, we preloaded yeast with14C‐lactate to about 0.2 nmol mg−1and subsequently placed the cells in lactate‐free buffer. Contrary to the import direction, which showed slower transport of the MCT1 F367Y mutants, the export rates were not significantly different from MCT1 wildtype. Relating the export data to the import rates therefore confirms the shifted transport equilibrium toward export in the MCT1 F367Y mutants.
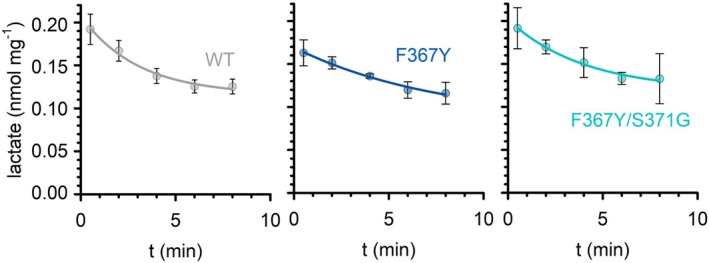
Lactate transport in the export direction via yeast‐expressed MCT1 wildtype (WT) and mutants. Cells were preloaded with14C‐labeled lactate and transferred into lactate free buffer. The curves were fitted to an exponential‐decay function (r2≥ 0.98). Error bars denote SEM. of technical duplicates.
Collision of the AddedF367YHydroxyl With a Substrate Oxygen May Explain Decreased Affinity
To gain insight into the molecular mechanism that determines substrate affinity in the MCT1 wildtype and F367Y mutant, we carried out atomic‐level simulations of wildtype and mutant MCT1 in hydrated lipid bilayers; each simulation was performed in duplicate and extended to 0.5 μs. We used the simulation trajectories to compute the hydrogen bond cluster of the lactate using the graph‐based algorithm Bridge/Bridge2 [33,34]. In Figure7A,B, left we illustrate the cluster of hydrogen bonds and water‐mediated bridges that are sampled during at least 50% of the time; numbers along the edges give the average length of the water‐mediated bridges between sidechains (replicas in FiguresS5andS6). In MCT1 wildtype, the lactate molecule sampled three direct hydrogen bonds (distance < 1 water) with the sidechains of Lys38, Ser154, and Arg313, and five water‐mediated bridges (distance > 1) with Tyr34, Tyr70, Asp309, Ser371, and Glu398 (Figure7A, left). In the MCT1 F367Y mutant, we found Tyr367 to largely occupy the former space of Ser371 and water‐bridging to lactate; it further recruits additional bridges to Tyr34, Tyr70, Ser371, and Glu398 (Figure7B, left). The molecular structure representation of the simulation shows a slightly rotated orientation of lactate in the binding sites of MCT1 wildtype and the MCT1 F367Y mutant, which we hypothesize might affect affinity (Figure7A,B, right).
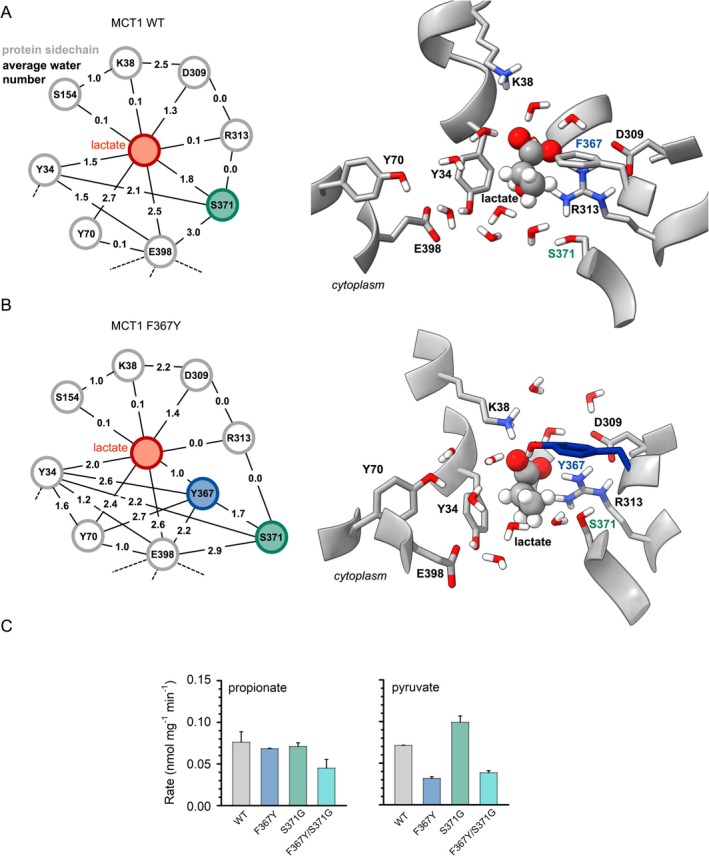
Hydrogen bond cluster of the lactate bound to MCT1, and transport of propionate and pyruvate. (A, B) Graph representations of the lactate hydrogen bond clusters (left) and molecular graphics of the lactate binding site in MCT1 wildtype (WT) and MCT1 F367Y. The numbers along the graph edges indicate the average number of water molecules in a bridge. Note that average water numbers < 1 indicate that the hydrogen bond is mostly direct between the two residues (graph nodes), whereas water numbers > 1 indicate a mostly water bridged connection. The graph nodes for Tyr367 and Ser371 are shown as circles filled blue and green, respectively. The molecular graphics on the right side are based on coordinate sets from the corresponding MD simulations. Note that the E398 has additional hydrogen bond connections, which are shown in FiguresS6andS7. (C) The bars depict initial transport rates for propionate and pyruvate transport via yeast‐expressed MCT1 and mutants.
To address this notion experimentally, we measured the transport rates for propionate and pyruvate with MCT1 wildtype and the MCT1 F367Y, S371G and F367Y/S371G double mutant. Propionate lacks an oxygen at the α‐carbon and should be unaffected by the F367Y mutation, whereas the α‐keto group of pyruvate should behave similarly to lactate. Indeed, the transport rate of pyruvate was decreased by 56% (MCT1 F367Y) and 47% (MCT1 F367Y/S371G), whereas propionate transport remained unaffected within the error margins (Figure7C). The MCT1 S371G mutation did not impede propionate or pyruvate transport (Figure7C). This corroborates the proposed collision of the tyrosine hydroxyl with lactate and pyruvate, and likely with other MCT more bulky substrates including β‐hydroxybutyrate, acetoacetate and even oxoproline carrying the oxygen in a γ‐lactam structure.
Activity of theMCT1InhibitorAZD3965Decreases WithM151A,F367Y, andS371GMutations in an Additive Manner
AZD3965 is a potent, nanomolar inhibitor of MCT1 exhibiting cross‐activity on MCT2, yet it has a minimal effect on MCT4 [35,36]. The binding mode to MCT1 was determined by cryo‐electron microscopy revealing four interacting residues that differ from MCT4, namely Met151, Leu281, Phe367, and Ser371 [26]. Functional analyses showed that mutation of Leu281 abolished the activity of AZD3965, whereas replacement of Met151 or Ser371 slightly decreased activity by a factor of 2. The MCT1 F367Y mutant could not be tested by the authors due to too low transport functionality. Since in our hands transport of the MCT1 F367Y mutant was sufficiently high, and this site turned out to be decisive to render transport properties of MCT1 toward MCT4‐like, we assayed the effect on AZD3965 activity. We further tested the MCT1 M151A and S371G single mutants and combinations for inhibition by AZD3965.
In line with the previous study, the M151A exchange hardly affected AZD3965 activity (Figure8A, yellow curve). However, the MCT1 F367Y and S371G single mutants equally decreased AZD3965 activity by one order of magnitude, and the combination was additive leading to a shift by two orders of magnitude (Figure8A, blue, green and turquoise curves, resp.). The MCT1 M151A/F367Y/S371G triple mutant decreased AZD3965 activity even further (Figure8A, orange curve). The data show that the discriminating Phe367/Ser371 positions between MCT1 and MCT4 are major AZD3965 interaction sites that similarly and jointly contribute to inhibitor activity.
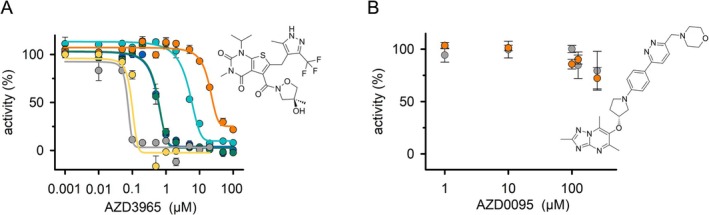
Action of MCT1 and MCT4 inhibitors on yeast‐expressed MCT1 and mutants. (A) IC50determinations (r2≥ 0.97) of the MCT1 inhibitor AZD3965 show decreased binding in MCT1 binding site mutants: MCT1 wildtype (gray), M151A (yellow), F367Y (blue), S371G (green), F367Y/S371G (turquoise), M151A/F367Y/S371G (orange). (B) The low activity of the MCT4 inhibitor AZD0095 remained unaffected by the triple mutation of MCT1 wildtype (gray) to M151A/F367Y/S371G (orange). Error bars denote SEM.
Recently, a potent nanomolar MCT4 inhibitor, AZD0095, was discovered [37]. Selectivity over MCT1 is reportedly greater than 1000 times. It is structurally unrelated to the MCT1 inhibitor AZD3965, and its binding site in MCT4 is unknown. We tested the MCT1 M151A/F367Y/S371G triple mutant for inhibition by AZD0095 to test for interactions at the substrate binding site (Figure8B). MCT1 wildtype and the triple mutant, however, showed equally low inhibition by AZD0095. This indicates that AZD0095 is likely an allosteric rather than a competitive inhibitor of MCT4 lactate transport.
Discussion
Our findings indicate that hydrogen bond interactions between the substrate and hydroxyl groups in the MCT binding site determine key properties of transport, including affinity, and inward/outward velocities. There are only a few examples that experimentally demonstrate a biased transport directionality of secondary active transporters. One is transport of glutamate via the excitatory amino acid carrier 1, EAAC1 [38]. Here, transport of glutamate with a net charge of −1 is co‐transported with three Na+ions. Sodium co‐transport strongly drives transport in the inward direction due to the steep inward transmembrane Na+gradient. This overcompensates for the repulsion of the negative charge of glutamate by the negative resting membrane potential. Nevertheless, EAAC1 glutamate transport also occurs in the outward direction, that is, against the electrochemical gradient of Na+. The authors provide evidence that under transmembrane steady‐state conditions glutamate export is faster and less voltage‐dependent than import. They suggest a model in which the order of binding events with respect to Na+and glutamate is responsible for the observed asymmetry. Another example also involves amino acid transport, albeit lysine with a net positive charge is transported by the yeast proton‐coupled lysine permease, Lyp1, which exhibits a strong preference for import [39]. Transport is driven by a proton inward gradient in combination with the favorable negative membrane resting potential. However, upon dissipation of the inward‐directed proton motive force, Lyp1 lysine transport in the export direction remains minimal. The authors generated equilibrium conditions in Lyp1‐containing proteoliposomes and determined highly asymmetric substrate affinity for the inward (μM range) and outward transport directions (mM range). They later identified sequence stretches in the extracellular loops of Lyp1 that modulate lysine affinity in an asymmetric fashion [40].
In the case of MCTs, a net neutral substrate for example, lactate/H+in a 1:1 stoichiometry is transported. Accordingly, the membrane potential is irrelevant for the transport process. We further adjusted the buffer pH to match the intracellular pH in our assay setup in order to avoid a directing transmembrane proton motive force. By keeping the amino acid positions (Lys38, Asp309, Arg313) the principal transport mechanism most likely remained unaltered. Still, the lactate transport appeared asymmetric, and shifted after the introduction of certain point mutations in the binding site of MCT1. Thermodynamics dictate that the intracellular concentration in our experiments cannot exceed the extracellularly provided 1 mM of lactate. It should be noted that unless all elements of the Haldane relationship have been measured, that is, lactate concentration inside and out and proton concentration inside and out, accumulation of lactate can be apparent. In the given 1 mM range, the shift in the equilibrium position in the steady‐state compared to MCT1 wildtype was about 2 times with MCT1 F367Y, and 5 times with the MCT1 M151A/F367Y/S371G triple mutant. One can calculate the change in the Gibbs energy, ΔΔG, associated with the shifted equilibrium positions of wildtype (Kwt) and mutant MCT1 (Kmut) using ΔΔG=R Tln(Kwt/Kmut) withRbeing the gas constant (8.314 J mol−1K−1) andTthe absolute temperature (291 K in the assays). This results in ΔΔGvalues of 1.68 kJ mol−1(MCT1 F367Y) and 3.89 kJ mol−1(MCT1 M151A/F367Y/S371G). These energy portions are smaller than the binding energy contained in a single hydrogen bond (> 8 kJ mol−1). It is therefore conceivable that differences in the arrangement and binding angles in the hydrogen bond network around the lactate substrate in the MCT isoforms can account for the observed differences in the transport kinetics. Asymmetry may derive from conformational differences at the binding site in the outward and inward open states of the transporter.
In addition to putatively asymmetric substrate binding affinities, different outward and inward open probabilities due to stabilization of one conformation could also generate a preference in transport directionality. In this regard, the MCT1 M151A mutant may eliminate a sulfur‐aromatic interaction which was found to contribute an energetic benefit of up to 6.3 kJ mol−1[41]. Two aromatic rings of Tyr34 and Phe375 are located within 5–6 Å to the Met151 sulfur atom (FigureS7). Such an interaction could contribute to the stabilization of the outward open conformation in MCT1 and MCT2 favoring import, as opposed to MCT3 and MCT4, which lack a sulfur‐containing residue in this region.
Using high‐resolution13C NMR allowed us, for the first time, to access the metabolism with much higher temporal resolution than before. The upper limit of the temporal resolution is the repetition time of the experiments, usually of the order of 100 ms (mostly for data collection). On the other side, the lower limit is given by the decay of the hyperpolarized state. This decay is likely the strongest impediment of the method, as it overlays all metabolic conversions. We accounted for this by fitting both the exchange and decay rates. Thus, using methods providing a time resolution of minutes (14C) or seconds (hyperpolarized13C) provided unique insights complementing uptake studies (14C) with subsequent metabolic conversion. Our data confirm that yeast as an alcohol rather than a lactic acid fermentation organism provides the opportunity to study lactate transport in the equilibrium state, which would not be achievable in lactate metabolizing systems including mammalian cells.
In previous studies on MCT1, we obtained evidence that the bound substrate itself accepts and relays the co‐transported proton [13]. Transport is thus coupled to chemical protonation/dissociation reactions, which may also induce asymmetry depending on the inward/outward state of the transporter. Finally, we and others found that the presence of the extracellular immunoglobulin‐like domain, Ig‐I, of the MCT‐associated protein basigin affects the equilibrium position of transport via MCT1 [14] and MCT4 [16]. Basigin with an intact Ig‐I domain promotes lactate import, whereas removal of the Ig‐I domain by a transmembrane protease [16] or artificial truncation shifts transport toward export by a factor of 4–5 [14]. The mechanism by which the extracellular domain of basigin generates asymmetry in MCT transport is not fully understood. It may facilitate substrate binding to the outward‐open MCT conformation or promote proton shuttling in the extracellular vestibule of the MCT by a dielectric effect similar to microbial monocarboxylate transporters of the formate/nitrate transporter family, FNT [42].
Most likely an interplay of the above‐mentioned mechanisms conveys asymmetry in MCT transport. Asymmetric transport properties of MCT1/MCT2 favoring import and MCT3/MCT4 favoring export are in line with their physiological tasks in lactate/H+shuttling [10]. While MCT1 and MCT2 primarily enable the uptake of lactate to fuel the citric acid cycle and oxidative phosphorylation, MCT3 and MCT4 serve as lactate exporters in the retinal pigment epithelium (MCT3) and in highly glycolytic tissues such as white muscle fibers and cells underlying the Warburg effect (MCT4) [12]. In the tumor microenvironment, lactate concentrations can rise up to supraphysiological levels of 10–30 mM [43] induced by glycolytic cells that export lactate via MCT4. In agreement with our findings and those of other groups, the MCT1 F367Y mutant, which introduces a hydroxyl group to mimic Tyr332 of MCT4, decreased lactate affinity into this lactate concentration range. There are only a few functional studies on MCT3 [44]. It is found solely at the basolateral membrane of the retinal pigment epithelium where it enables transepithelial lactate transport together with the apical MCT1 [45]. MCT3 serves as a designated lactate exporter to the choroidal circulation.
In conclusion, the determination of thekin/kout‐ratio under metabolism‐free steady‐state assay conditions yielded novel insight into protein‐intrinsic MCT transport asymmetry. The data provide a structural and functional basis that contributes to the understanding of the various roles of the MCT isoforms in physiological settings.
Materials and Methods
Plasmids and Mutations
The expression constructs of human MCT1 with N‐terminal hemagglutinin‐ and C‐terminal His10‐tags in pDR196 (His3 selection marker) [14], and thel‐lactate‐biosensor iLACCO1 [46] in pRS413 (Ura3 selection marker) for co‐expression were described previously [47]. Site‐directed mutagenesis of the MCT1 coding sequence was done using primers listed in TableS1, and confirmed by sequencing.
Yeast Transformation and Culture
S. cerevisiaeyeast lacking endogenous monocarboxylate transporters (W3031A‐1A jen1Δ ady2Δ; MATa leu2‐3112 trp1‐1 can1‐100 ura3‐1 ade2‐1 his3‐11,15 jen1::kanMX4 ady2::hphMX4), kindly provided by M. Casal [29], was transformed using the PEG/lithium acetate/single stranded carrier DNA protocol [48]. Transformed cells were selected at 29°C on SD agar supplemented with 2% (w/v) glucose, plus adenine, leucine, and tryptophan, but lacking either histidine or uracil or both for plasmid selection [47].
Hyperpolarized13C‐NMRSpectroscopy
Dissolution dynamic nuclear polarization (dDNP) samples were prepared by mixing 14 M [1–13C]pyruvate (Sigma‐Aldrich, 677175, CAS: 99124‐30‐8) with 30 mM trityl radical (Polarize, AH111501) or 2.5 M [1–13C]lactate with 16 mM trityl radical, 280 mM glycerin (G9012, CAS: 56‐81‐5, Sigma‐Aldrich), and 2.4 mM gadolinium (gadobutrol Gd‐DO3A‐butrol, 1 mmol/mL; Gadovist, Bayer) in H2O (Carl Roth, ID 3478.1). The dissolution medium for pyruvate was prepared by mixing 1.51 g of Trizma pre‐set crystals (Sigma‐Aldrich, T7943), 27 mg of EDTA (SERVA, 11280.02), 0.756 g of NaCl (Sigma‐Aldrich, S98881), and 0.81 g of NaOH (Carl Roth, 9356.1) in 250 mL of H2O. For lactate, 300 mg of Trizma were combined with 3.9 mg of EDTA in 50 mL of H2O. No extra purification of the chemicals was performed. Hyperpolarization was performed using a cryogen‐free dDNP system (SpinAligner, Polarize), operating at about 1.3 K and 6.7 T with a microwave frequency between 186.995 and 187.045 GHz at 20 mW as detailed previously [49]. During each dDNP experiment, the polarization buildup (20 μL pyruvate or 50 μL lactate sample) was observed using13C NMR in the solid state (ca. 1° excitation every 2–5 min), yielding characteristic time constants of about 20 min for pyruvate and 50 min for lactate. The samples were rapidly dissolved by adding 3.8 mL of superheated dissolution medium (pH of 7.5–7.6), and 280 μL were added to ca. 200 μL of yeast suspension inside a 5 mm NMR tube inside a 9.4 T NMR spectrometer (200 mg/mL cells in 0.2 M KH2PO4yielding a pH 5.7–5.9, and 56 mM pyruvate or 21 mM lactate final concentrations, at 37°C; Bruker WB 400, 9.4 T, AvanceNeo, Paravision 360, BBFO probe). The time of detection was ca. 15 to 23 s after dissolution. The data was apodized by a 3 Hz exponential function in the time domain for the kinetics. Phase correction and a third‐order polynomial baseline correction was applied for each metabolite peak after Fourier transform and before numerical integration (MNova, 14.2.2, Mestrelab Research S.L.). The metabolism kinetics were analyzed using the Broyden–Fletcher–Goldfarb–Shanno algorithm to minimize the system of ordinary differential equations for the substrate and up to four products described previously [50].
Membrane Protein Extraction and Western Blotting
50 mL of yeast culture were grown to at an OD600of 1.0 ± 0.1, harvested at 4000g, 5 min, 4°C, and washed with 10 mL ice‐cold TE buffer (25 mM TRIS–HCl, 5 mM EDTA, pH 7.5). Cell pellets were stored at—80°C. For disruption, pellets were resuspended in 0.5 mL TE buffer and vortexed with 0.5 mL acid‐washed glass beads (Ø 425–600 μm, Sigma Aldrich) in 15 cycles of 30 s each. Glass beads and cell debris were removed by centrifugation at 1000g, 5 min, 4°C, and subsequently at 10 000g, 5 min, 4°C. The microsomal fraction was collected by ultracentrifugation at 100 000g, 45 min, 4°C. The membrane pellets were resuspended in 100 μL of 100 mM Na2HPO4, pH 8.0, with 50 mM NaCl. 30 μg of total protein (Bradford assay, Bio‐Rad) were separated by SDS‐PAGE (12.5% acrylamide, peqGold III protein marker, VWR), and blotted on PVDF membrane (Hybond P 0.45, GE Healthcare). Detection was carried out by using a monoclonal mouse anti‐hemagglutinine antibody (Roche Diagnostics), a horseradish‐peroxidase‐conjugated secondary goat‐anti‐mouse antibody (Jackson ImmunoResearch) and freshly mixed ECL reagent (6.7 mMp‐coumaric acid, 1.3 mM luminol, 90 mM Tris–HCl, pH 8.6, 0.03% H2O2) in a ChemoStar Touch Imager (INTAS Science Imaging Instruments).
Transmembrane Transport Assay Using14C‐l‐Lactate
Transport of radiolabeledl‐lactate was measured as described previously [51]. In brief, yeast cells were grown to an OD600of 1.0 ± 0.1, harvested at 4000g, 5 min, 4°C, washed with cold water, resuspended in 50 mM HEPES/Tris (pH 6.8) to an OD600of 50 ± 5, and kept on ice. For the transport assay, 80 μL of cell suspension per sample were prewarmed to 19°C. Uptake was initiated by adding 20 μL of14C‐spikedl‐lactate, propionate or pyruvate (Hartmann Analytics) solution (1 mM final concentration, 0.04 μCi/sample). For export measurements, the cell samples were incubated with14C‐spiked lactate solution for 2–16 min until an intracellular lactate level of about 0.2 nmol mg−1was reached. For Michaelis–Menten kinetics,l‐lactate solutions were added to yield final concentrations in the range of 0.5–20 mM with 0.04–0.12 μCi radiolabel per sample. At the indicated time points, transport was stopped by removal of the supernatant by vacuum filtration through GF/C glass microfiber filters, and washing with 7 mL of ice‐cold water. The filters were placed in 3 mL of scintillation cocktail (ROTISZINTeco plus, Carl Roth), and analyzed by liquid scintillation counting (Packard TriCarb 2900TR, Perkin Elmer). Cell‐adhering background radiolabel was determined from non‐expressing cells and subtracted.
Homology Modeling ofMCT1
The experimental structure of open‐state MCT1 [26] solved at a resolution of 3.30 Å lacks coordinates for a 60 residue domain between transmembrane helices (TM) 6 and 7. We used ColabFold v.1.5.5 [52] with a custom template selection to generate structural models of wild‐type human MCT1 with this 60‐residue domain. As templates we used the structures of open‐state MCT1 bound to lactate (PDB# 6LZ0) and bound to an inhibitor (PDB ID: 6LYY) [26]. Following initial attempts to generate a full‐length MCT1 model, we removed from the sequence the disordered N‐ and C‐ termini and generated the model for the residue range G16 to A449. We inspected all generated models and chose the structural model with the smallest root mean square deviation (RMSD) value of 0.64 Å for the TM region of the model vs. experimental structure of open‐state MCT1. We added the Basigin protein and the lactate molecule from the experimental structure of the MCT1‐Basigin‐lactate complex (PDB ID: 6LZ0) [26]. To model the F367Y mutant we used CHARMM‐GUI [53]. All titratable sidechains were considered in their standard protonation sites and the lactate molecule was negatively charged.
Molecular Dynamics (MD) Simulations
We used the Positioning of Proteins in Membranes server [54] to orient the structure along membrane normal and CHARMM‐GUI Membrane Builder [53,55,56] to embed the Basigin‐MCT1‐lactate complex in a hydrated 1‐palmitoyl‐2‐oleoyl‐sn‐glycero‐3‐phosphocholine (POPC). The system was neutralized using a concentration of 0.15M of potassium chloride salt (KCl). We performed MD simulations using GROMACS 2023.2 [56,57] with the CHARMM36m force field [58,59,60,61] for protein, lipids, and ions, and the TIP3 water model [62]. The equilibration and geometry optimization were done using standard CHARMM‐GUI protocol. The equilibration was performed in NPT ensemble (constant number of particles N, constant pressure P, and constant temperature T), at a temperature of 303.15 K. We used a switching function between 10 and 12 Å for non‐bonded interactions, Particle Mesh Ewald (PME) for electrostatics, and an integration time step of 2 fs. We saved coordinates each 100 ps. We extended each simulation to 500 ns. Replica simulations for the WT and mutant MCT1 protein complexes were initiated from the same starting coordinates using different starting velocities (FiguresS5andS6).
Graph Computations of Lactate‐Protein‐Water Hydrogen Bond Networks
To compute hydrogen bond networks we used the graph‐based algorithm and graphical user interface Bridge/Bridge2 [33,34]. Hydrogen bond graphs we report consist of nodes (lactate and protein sidechains) and edges (direct hydrogen bonds and water‐mediated bridges between the nodes). We identified hydrogen bonds using geometric criteria of hydrogen‐bond distance ≤ 3.5 Å and angle ≤ 60°. From each simulation we used 2000 equally spaced coordinate snapshots from the last 200 ns and computed hydrogen bonds graphs for direct hydrogen bonds and water mediated bridges with up to 3 hydrogen‐bonded water molecules in the bridge. Thus, the average length of a water‐mediated bridge between two graph nodes (two protein residues) can take values between 0.0 (direct hydrogen‐bond) and 3.0 (three hydrogen‐bonded water molecules). We used Connected Component Analyses [63] in Bridge [33] to extract, from each hydrogen‐bond graph, the hydrogen‐bond cluster of the lactate molecule; this cluster consists of the graph nodes and edges that connect to the node of the lactate. The average occupancy of a hydrogen‐bond (direct or water mediated) indicates the percentage of coordinate sets in which the hydrogen‐bond criteria are met. For clarity, we show only hydrogen bond connections that are present during at least 50% of the trajectory segments used for data analyses.
Determination of Inhibitor Activity
Pelleted yeast cells co‐expressing MCT1 wildtype or MCT1 M151A/F367Y/S371G with iLACCO1 were resuspended to an OD600of 5 ± 0.5 in 50 mM HEPES/Tris, pH 6.8 and kept on ice. 80 μL of cell suspensions were incubated for 15 min at room temperature with 1 μL of inhibitor solution in DMSO (range 0–8 mM for AZD3965, or 0–20 mM for AZD0095) in 96‐well plates. In a plate reader (Spark, Tecan), 20 μL ofl‐lactate solution were added well‐by‐well to establish an inward gradient of 1 mM. The cells were shaken at 510 rpm for 3 s and the change in fluorescence signal intensity, (F—F0)/F0, was monitored over 30 s (λex484 ± 10 nm,λem515 ± 10 nm). Inhibitor activity was determined as IC50after normalization of the fluorescence intensities obtained with uninhibited (100%) and fully blocked transporter (0%) [47].
Statistical Analysis
Curve fittings and graph visualizations were done using SigmaPlot(Systat Software). Lactate transport, Michaelis–Menten kinetics, and IC50values were determined from three biological replicates, each in technical duplicates. Data represent mean ± SEM.
Author Contributions
Ioana‐Daniela Dumitru:conceptualization, investigation, writing – original draft, methodology, validation, visualization, formal analysis, software.Maike Menzel:investigation, conceptualization, methodology, validation, visualization, writing – original draft, formal analysis, writing – review and editing.Jan‐Bernd Hövener:conceptualization, funding acquisition, validation, supervision, methodology, writing – original draft, data curation.Josh Peters:conceptualization, investigation, writing – original draft, methodology, validation, formal analysis, visualization.Ana‐Nicoleta Bondar:conceptualization, funding acquisition, writing – original draft, validation, visualization, methodology, software, supervision, formal analysis, resources, data curation.Andrey N. Pravdivtsev:conceptualization, investigation, validation, visualization, supervision, writing – original draft.Eric Beitz:conceptualization, funding acquisition, writing – original draft, methodology, validation, writing – review and editing, formal analysis, project administration, supervision, resources, data curation.
Funding
This study was supported by the European Union's Horizon 2020/2024 research and innovation programmes under the Marie Skłodowska‐Curie grants PROTON no. 860592 and WATER no. 101227436 (to A.‐N.B and E.B.). I‐DD is supported by a doctoral scholarship from the Doctoral School of the Faculty of Physics of the University of Bucharest. The Authors gratefully acknowledge computing time on the supercomputer JURECA at the Forschungszentrum Jülich under grant no. DYNAMICNETWORKS. A.N.P., J.P., J.B.H. acknowledge funding from the German Federal Ministry of Education and Research (BMBF, 03WIR6208A hyperquant), DFG (555951950, 527469039, 469366436, HO‐4602/2‐2, HO‐4602/3, EXC2167, FOR5042, TRR287). MOIN CC was founded with a grant from the European Regional Development Fund (ERDF), the Zukunftsprogramm Wirtschaft of Schleswig‐Holstein (Project no. 122‐09‐053), the Medical Faculty, and Kiel University.
Ethics Statement
The authors have nothing to report.
Conflicts of Interest
The authors declare no conflicts of interest.
References
- M. A. Felmlee, R. S. Jones, V. Rodriguez‐Cruz, K. E. Follman, andM. E. Morris, “Monocarboxylate Transporters (SLC16): Function, Regulation, and Role in Health and Disease, ”Pharmacological Reviews72(2020): 466–485. doi.org/10.1124/pr.119.018762
- C. Manosalva, J. Quiroga, A. I. Hidalgo, et al. , “Role of Lactate in Inflammatory Processes: Friend or Foe, ”Frontiers in Immunology14(2022): 808799. doi.org/10.3389/fimmu.2021.808799
- V. L. Payen, E. Mina, V. F. Van Hée, et al. , “Monocarboxylate Transporters in Cancer, ”Molecular Metabolism33(2020): 48–66. doi.org/10.1016/j.molmet.2019.07.006
- O. Warburg, F. Wind, andE. Negelein, “The Metabolism of Tumors in the Body, ”Journal of General Physiology7(1927): 519–530. doi.org/10.1085/jgp.8.6.519
- M. G. Vander Heiden, L. C. Cantley, andC. B. Thompson, “Understanding the Warburg Effect: The Metabolic Requirements of Cell Proliferation, ”Science324(2009): 1029–1033. doi.org/10.1126/science.1160809
- S. Pavlides, D. Whitaker‐Menezes, R. Castello‐Cros, et al. , “The Reverse Warburg Effect: Aerobic Glycolysis in Cancer Associated Fibroblasts and the Tumor Stroma, ”Cell Cycle8(2009): 3984–4001. doi.org/10.4161/cc.8.23.10238
- L. Wilde, M. Roche, M. Domingo‐Vidal, et al. , “Metabolic Coupling and the Reverse Warburg Effect in Cancer: Implications for Novel Biomarker and Anticancer Agent Development, ”Seminars in Oncology44(2017): 198–203. doi.org/10.1053/j.seminoncol.2017.10.004
- C. JuelandA. P. Halestrap, “Lactate Transport in Skeletal Muscle – Role and Regulation of the Monocarboxylate Transporter, ”Journal of Physiology517(1999): 633–642. doi.org/10.1111/j.1469-7793.1999.0633s.x
- P. J. MagistrettiandI. Allaman, “Lactate in the Brain: From Metabolic End‐Product to Signalling Molecule, ”Nature Reviews. Neuroscience19(2018): 235–249. doi.org/10.1038/nrn.2018.19
- A. P. HalestrapandM. C. Wilson, “The Monocarboxylate Transporter Family—Role and Regulation, ”IUBMB Life64(2012): 109–119. doi.org/10.1002/iub.572
- M. C. Wilson, D. Meredith, C. Bunnun, R. B. Sessions, andA. P. Halestrap, “Studies on the DIDS‐Binding Site of Monocarboxylate Transporter 1 Suggest a Homology Model of the Open Conformation and a Plausible Translocation Cycle, ”Journal of Biological Chemistry284(2009): 20011–20021. doi.org/10.1074/jbc.M109.014217
- P. D. Bosshart, D. Kalbermatter, S. Bonetti, andD. Fotiadis, “Mechanistic Basis ofl‐Lactate Transport in the SLC16 Solute Carrier Family, ”Nature Communications10(2019): 2649. doi.org/10.1038/s41467-019-10566-6
- K. Geistlinger, J. D. R. Schmidt, andE. Beitz, “Human Monocarboxylate Transporters Accept and Relay Protons via the Bound Substrate for Selectivity and Activity at Physiological pH, ”PNAS Nexus2(2023): pgad007. doi.org/10.1093/pnasnexus/pgad007
- A. L. Köpnick, A. Jansen, K. Geistlinger, N. H. Epalle, andE. Beitz, “Basigin Drives Intracellular Accumulation ofl‐Lactate by Harvesting Protons and Substrate Anions, ”PLoS One16(2021): e0249110. doi.org/10.1371/journal.pone.0249110
- P. Kirk, M. C. Wilson, C. Heddle, M. H. Brown, A. N. Barclay, andA. P. Halestrap, “CD147 Is Tightly Associated With Lactate Transporters MCT1 and MCT4 and Facilitates Their Cell Surface Expression, ”EMBO Journal19(2000): 3896–3904. doi.org/10.1093/emboj/19.15.3896
- B. L. Updegraff, X. Zhou, Y. Guo, et al. , “Transmembrane Protease TMPRSS11B Promotes Lung Cancer Growth by Enhancing Lactate Export and Glycolytic Metabolism, ”Cell Reports25(2018): 2223–2233. doi.org/10.1016/j.celrep.2018.10.100
- D. Baiskhanova, M. Menzel, C. Geismann, et al. , “Transmembrane Protease Serine 11B Modulates Lactate Transport Through SLC16A1 in Pancreatic Ductal Adenocarcinoma – A Functional Link to Phenotype Heterogeneity, ”International Journal of Molecular Sciences26(2025): 5398. doi.org/10.3390/ijms26115398
- J. E. Combs, A. B. Murray, C. L. Lomelino, et al. , “Disruption of the Physical Interaction Between Carbonic Anhydrase IX and the Monocarboxylate Transporter 4 Impacts Lactate Transport in Breast Cancer Cells, ”International Journal of Molecular Sciences25(2024): 11994. doi.org/10.3390/ijms252211994
- N. H. EpalleandE. Beitz, “Local Attraction of Substrates and Co‐Substrates Enhances Weak Acid and Base Transmembrane Transport, ”Biomolecules12(2022): 1794. doi.org/10.3390/biom12121794
- E. Jaeger, S. Buss, andE. Beitz, “Intrinsic Asymmetry in Weak Acid Transmembrane Transporters, ”Biomolecules16(2026): 91. doi.org/10.3390/biom16010091
- A. P. Halestrap, “The Monocarboxylate Transporter Family—Structure and Functional Characterization, ”IUBMB Life64(2012): 1–9. doi.org/10.1002/iub.573
- S. Bröer, A. Bröer, H. P. Schneider, C. Stegen, A. P. Halestrap, andJ. W. Deitmer, “Characterization of the High‐Affinity Monocarboxylate Transporter MCT2 inXenopus laevisOocytes, ”Biochemical Journal314(1999): 529–535. doi.org/10.1042/0264-6021:3410529
- K. S. Dimmer, B. Friedrich, F. Lang, J. W. Deitmer, andS. Bröer, “The Low‐Affinity Monocarboxylate Transporter MCT4 Is Adapted to the Export of Lactate in Highly Glycolytic Cells, ”Biochemical Journal350(2000): 219–227.
- J. E. Manning Fox, D. Meredith, andA. P. Halestrap, “Characterisation of Human Monocarboxylate Transporter 4 Substantiates Its Role in Lactic Acid Efflux From Skeletal Muscle, ”Journal of Physiology529(2000): 285–293. doi.org/10.1111/j.1469-7793.2000.00285.x
- Y. Contreras‐Baeza, P. Y. Sandoval, R. Alarcón, et al. , “Monocarboxylate Transporter 4 (MCT4) is a High Affinity Transporter Capable of Exporting Lactate in High‐Lactate Microenvironments, ”Journal of Biological Chemistry294(2019): 20135–20147. doi.org/10.1074/jbc.RA119.009093
- N. Wang, X. Jiang, S. Zhang, et al. , “Structural Basis of Human Monocarboxylate Transporter 1 Inhibition by Anti‐Cancer Drug Candidates, ”Cell184(2021): 370–383. doi.org/10.1016/j.cell.2020.11.043
- B. Zhang, Q. Jin, L. Xu, et al. , “Cooperative Transport Mechanism of Human Monocarboxylate Transporter 2, ”Nature Communications11(2020): 2429. doi.org/10.1038/s41467-020-16334-1
- Y. Futagi, M. Kobayashi, K. Narumi, A. Furugen, andK. Iseki, “Homology Modeling and Site‐Directed Mutagenesis Identify Amino Acid Residues Underlying the Substrate Selection Mechanism of Human Monocarboxylate Transporters 1 (hMCT1) and 4 (hMCT4), ”Cellular and Molecular Life Sciences76(2019): 4905–4921. doi.org/10.1007/s00018-019-03151-z
- I. Soares‐Silva, S. Paiva, G. Diallinas, andM. Casal, “The Conserved Sequence NXX[S/T]HX[S/T]QDXXXT of the Lactate/Pyruvate: H(+) Symporter Subfamily Defines the Function of the Substrate Translocation Pathway, ”Molecular Membrane Biology24(2007): 464–474. doi.org/10.1080/09687680701342669
- M. Karlsson, P. R. Jensen, J. H. Ardenkjaer‐Larsen, et al. , “Difference Between Extra‐ and Intracellular T1 Values of Carboxylic Acids Affects the Quantitative Analysis of Cellular Kinetics by Hyperpolarized NMR, ”Angewandte Chemie, International Edition55(2016): 13567–13570. doi.org/10.1002/anie.201607535
- J. B. Hövener, A. N. Pravdivtsev, B. Kidd, et al. , “Parahydrogen‐Based Hyperpolarization for Biomedicine, ”Angewandte Chemie, International Edition57(2018): 11140–11162. doi.org/10.1002/anie.201711842
- A. L. Köpnick, K. Geistlinger, andE. Beitz, “Cysteine 159 Delineates a Hinge Region of the Alternating Access Monocarboxylate Transporter 1 and Is Targeted by Cysteine‐Modifying Inhibitors, ”FEBS Journal288(2021): 6052–6062. doi.org/10.1111/febs.16024
- M. Siemers, M. Lazaratos, K. Karathanou, F. Guerra, L. S. Brown, andA. N. Bondar, “Bridge: A Graph‐Based Algorithm to Analyze Dynamic H‐Bond Networks in Membrane Proteins, ”Journal of Chemical Theory and Computation15(2019): 6781–6798. doi.org/10.1021/acs.jctc.9b00697
- M. SiemersandA. N. Bondar, “Interactive Interface for Graph‐Based Analyses of Dynamic H‐Bond Networks: Application to Spike Protein, S, ”Journal of Chemical Information and Modeling61(2021): 2998–3014. doi.org/10.1021/acs.jcim.1c00306
- N. J. Curtis, L. Mooney, L. Hopcroft, et al. , “Pre‐Clinical Pharmacology of AZD3965, a Selective Inhibitor of MCT1: DLBCL, NHL and Burkitt's Lymphoma Anti‐Tumor Activity, ”Oncotarget8(2017): 69219–69236. doi.org/10.18632/oncotarget.18215
- M. J. Ovens, A. J. Davies, M. C. Wilson, C. M. Murray, andA. P. Halestrap, “AR‐C155858 Is a Potent Inhibitor of Monocarboxylate Transporters MCT1 and MCT2 That Binds to an Intracellular Site Involving Transmembrane Helices 7–10, ”Biochemical Journal425(2010): 523–530. doi.org/10.1042/BJ20091515
- F. W. Goldberg, J. G. Kettle, G. M. Lamont, et al. , “Discovery of Clinical Candidate AZD0095, a Selective Inhibitor of Monocarboxylate Transporter 4 (MCT4) for Oncology, ”Journal of Medicinal Chemistry66(2023): 384–397. doi.org/10.1021/acs.jmedchem.2c01342
- Z. Zhang, Z. Tao, A. Gameiro, et al. , “Transport Direction Determines the Kinetics of Substrate Transport by the Glutamate Transporter EAAC1, ”Proceedings of the National Academy of Sciences of the United States of America104(2007): 18025–18030. doi.org/10.1073/pnas.0704570104
- F. Bianchi, J. S. Van't Klooster, S. J. Ruiz, et al. , “Asymmetry in Inward‐ and Outward‐Affinity Constant of Transport Explain Unidirectional Lysine Flux inSaccharomyces cerevisiae, ”Scientific Reports6(2016): 31443. doi.org/10.1038/srep31443
- J. S. Van't Klooster, F. Bianchi, R. B. Doorn, et al. , “Extracellular Loops Matter—Subcellular Location and Function of the Lysine Transporter Lyp1 FromSaccharomyces cerevisiae, ”FEBS Journal287(2020): 4401–4414. doi.org/10.1111/febs.15262
- C. C. Valley, A. Cembran, J. D. Perlmutter, et al. , “The Methionine‐Aromatic Motif Plays a Unique Role in Stabilizing Protein Structure, ”Journal of Biological Chemistry287(2012): 34979–34991. doi.org/10.1074/jbc.M112.374504
- M. WiechertandE. Beitz, “Mechanism of Formate‐Nitrite Transporters by Dielectric Shift of Substrate Acidity, ”EMBO Journal36(2017): 949–958. doi.org/10.15252/embj.201695776
- K. G. de la Cruz‐López, L. J. Castro‐Muñoz, D. O. Reyes‐Hernández, A. García‐Carrancá, andJ. Manzo‐Merino, “Lactate in the Regulation of Tumor Microenvironment and Therapeutic Approaches, ”Frontiers in Oncology9(2019): 1143. doi.org/10.3389/fonc.2019.01143
- E. F. Grollman, N. J. Philp, P. McPhie, R. D. Ward, andB. Sauer, “Determination of Transport Kinetics of Chick MCT3 Monocarboxylate Transporter From Retinal Pigment Epithelium by Expression in Genetically Modified Yeast, ”Biochemistry39(2000): 9351–9357. doi.org/10.1021/bi000464+
- N. J. Philp, H. Yoon, andE. F. Grollman, “Monocarboxylate Transporter MCT1 Is Located in the Apical Membrane and MCT3 in the Basal Membrane of Rat RPE, ”American Journal of Physiology274(1998): R1824–R1828. doi.org/10.1152/ajpregu.1998.274.6.R1824
- S. Hario, G. N. T. Le, H. Sugimoto, et al. , “High‐Performance Genetically Encoded Green Fluorescent Biosensors for Intracellularl‐Lactate, ”ACS Central Science10(2024): 402–416. doi.org/10.1021/acscentsci.3c01250
- F. Tiedjens, M. Menzel, P. Stahnke, et al. , “A Yeast‐Based Assay for Inhibitors ofl‐Lactate Transport Utilizing Fluorescent Biosensors, ”ChemMedChem20(2024): e202400918. doi.org/10.1002/cmdc.202400918
- R. D. GietzandR. H. Schiestl, “High‐Efficiency Yeast Transformation Using the LiAc/SS Carrier DNA/PEG Method, ”Nature Protocols2(2007): 31–34. doi.org/10.1038/nprot.2007.13
- A. Ferrari, J. Peters, M. Anikeeva, et al. , “Performance and Reproducibility of13C and15N Hyperpolarization Using a Cryogen‐Free DNP Polarizer, ”Scientific Reports12(2022): 11694. doi.org/10.1038/s41598-022-15380-7
- J. P. Peters, C. Assaf, F. H. Mohamad, et al. , “Yeast Solutions and Hyperpolarization Enable Real‐Time Observation of Metabolized Substrates Even at Natural Abundance, ”Analytical Chemistry96(2024): 17135–17144. doi.org/10.1021/acs.analchem.4c02419
- B. Wu, J. Rambow, S. Bock, et al. , “Identity of aPlasmodiumLactate/H(+) Symporter Structurally Unrelated to Human Transporters, ”Nature Communications6(2015): 6284. doi.org/10.1038/ncomms7284
- M. Mirdita, K. Schütze, Y. Moriwaki, L. Heo, S. Ovchinnikov, andM. Steinegger, “ColabFold: Making Protein Folding Accessible to All, ”Nature Methods19(2022): 679–682. doi.org/10.1038/s41592-022-01488-1
- S. Jo, T. Kim, V. G. Iyer, andW. Im, “CHARMM‐GUI: A Web‐Based Graphical User Interface for CHARMM, ”Journal of Computational Chemistry29(2008): 1859–1865. doi.org/10.1002/jcc.20945
- M. A. Lomize, I. D. Pogozheva, H. Joo, H. I. Mosberg, andA. L. Lomize, “OPM Database and PPM Web Server: Resources for Positioning of Proteins in Membranes, ”Nucleic Acids Research40(2012): D370–D376. doi.org/10.1093/nar/gkr703
- E. L. Lee, X. Cheng, S. Jo, et al. , “CHARMM‐GUI Membrane Builder Toward Realistic Biological Membrane Simulations, ”Journal of Computational Chemistry35(2014): 1997–2004. doi.org/10.1002/jcc.23702
- J. Lee, X. Cheng, J. M. Swails, et al. , “CHARMM‐GUI Input Generator for NAMD, GROMACS, AMBER, OpenMM, and CHARMM/OpenMM Simulations Using the CHARMM36 Additive Force Field, ”Journal of Chemical Theory and Computation12(2015): 405–413. doi.org/10.1021/acs.jctc.5b00935
- M. J. Abraham, T. Murtola, R. Schulz, et al. , “GROMACS: High Performance Molecular Simulations Through Multi‐Level Parallelism From Laptops to Supercomputers, ”SoftwareX1–2(2015): 19–25.
- B. R. Brooks, R. E. Bruccoleri, B. D. Olafson, et al. , “CHARMM: A Program for Macromolecular Energy, Minimization, and Dynamics Calculations, ”Journal of Computational Chemistry4(1983): 187–217.
- S. E. Feller, Y. Zhang, R. W. Pastor, andB. R. Brooks, “Constant Pressure Molecular Dynamics Simulation: The Langevin Piston Method, ”Journal of Chemical Physics103(1995): 4613–4621.
- B. R. Brooks, C. L. Brooks, III, A. D. Mackerell, et al. , “CHARMM: The Biomolecular Simulation Program, ”Journal of Computational Chemistry30(2009): 1545–1615. doi.org/10.1002/jcc.21287
- J. B. Klaudia, R. M. Venable, J. A. Freites, et al. , “Update of the CHARMM All‐Atom Additive Force Field for Lipids: Validation on Six Lipid Types, ”Journal of Physical Chemistry. B114(2010): 7830–7843. doi.org/10.1021/jp101759q
- W. L. Jorgensen, J. Chandrasekhar, J. D. Madura, R. W. Impey, andM. L. Klein, “Comparison of Simple Potential Functions for Simulating Liquid Water, ”Journal of Chemical Physics79(1983): 926–935.
- T. H. Cormen, C. E. Leiserson, R. L. Rivest, et al. , Introduction to Algorithms(MIT Press, 2008).
Republished from the open web under CC-BY. Authors: Menzel M, Dumitru ID, Peters J, Hövener JB, Pravdivtsev AN, Bondar AN, Beitz E. Read the original.