Sexual prejudice declined across generational cohorts and genders: A cohort sequential latent growth curve model from 2014 to 2024.
Despite attitudes towards the LGBTQIA+ community improving in recent years, older (vs younger) cohorts still report higher rates of sexual prejudice. To date, it is unclear if this generational difference emerges due to normative ageing or the distinct social norms in which each generation was born and raised (cohort effects). This pre-registered study clarifies the issue by utilizing cohort sequential latent growth curve modelling to examine the developmental trajectory of sexual prejudice for men and women across 11 annual waves of longitudinal panel data (N = 63,558). Our results reveal a period effect in which older (vs younger) cohorts and men (vs women) display higher initial mean levels of sexual prejudice. But due to shared social conditions, most cohorts experience comparable curvilinear declines in sexual prejudice across time. Collectively, our results highlight the malleability of sexual prejudice across the lifespan and demonstrate the need to examine the socio-political environment when taking a lifespan development perspective on anti-LGBTQIA+ attitudes.
INTRODUCTION
Support for the LGB+ community has increased considerably during the 21st century. For example, whereas same‐sex marriage was a ‘hot‐button’ issue in the early 2000s, support for same‐sex relationships is now a hallmark of Western democracies (Baunach,2012; Brickell,2020; Kite,2011). Indeed, same‐sex relationships are decriminalized in over 100 countries (ILGA,2025), with same‐sex marriage and adoption being legal in over 30 countries (Equaldex,2025). Beyond legal protections, social acceptance of the LGBTQIA+ community has grown in recent years with a remarkable rise in pro‐LGBTQIA+ campaigns, art, music and media (Kite,2011; McInroy & Shelley,2017; Nölke,2018). It is perhaps unsurprising, then, that scholars have grown optimistic about the progress of LGBTQIA+ rights, with emerging research demonstrating that support for same‐sex relationships is steadily increasing over time (Baunach,2012; Kreitzer et al.,2014).
Despite this promising trend towards equality, the existing scholarship reveals a generational divide whereby older cohorts have higher levels of sexual prejudice than their younger counterparts (Herek,2009; Herek & McLemore,2013). To date, it remains unclear exactlywhythis trend occurs. One perspective suggests that this generational gap is due to normative ageing and that people simply become more conservative as they age (e.g., Peterson et al.,2020; Wilson,1996). However, an alternative scholarship posits that differences between generations occur due to distinct socialization experiences (e.g., Crandall et al.,2018). Because ageing and social changes unfold simultaneously, fully distinguishing between these two processes requires large‐scale longitudinal data that captures the lifespan development of sexual prejudice over time.
To these ends, the current pre‐registered study utilizes 11 annual waves of longitudinal panel data spanning 10 years to assess whether changes in sexual prejudice reflect normative developmental processes (ageing effect), a general trend across time among birth cohorts (period effect) or enduring differences between birth cohorts (e.g., cohort effect). We begin by unpacking the ageing perspective. Next, we highlight the impact of egalitarian social shifts on prejudiced attitudes and the impressionable years hypothesis. We conclude by highlighting the importance of our unique analytic approach and the hypotheses of the current study.
THE DEVELOPMENT OF SEXUAL PREJUDICE OVER TIME
Ageing effects
Scholars initially assumed that generational differences in sexual prejudice emerge because people become more prejudiced as they age (Peterson et al.,2020; Wilson,1996). Indeed, the ageing process encompasses various psychological, social, economic and biological changes that are thought to affect people's prejudiced attitudes (Peterson et al.,2020). For example, normative ageing spans work, familial and financial stability, as well as declines in physical health and cognition (Sears,1981; St. Jacques et al.,2009). Thus, as people age, tolerance for uncertainty, openness and contact with outgroups often decline (Jost et al.,2007; Peterson et al.,2020). Moreover, death anxiety and preferences for order, security and hierarchy increase (Jost et al.,2007). Because uncertainty avoidance and threat management predict conservative values (Jost et al.,2007), changes in sexual prejudice over time may reflect normative ageing processes. According to this perspective, people at similar life stages will share the same level of sexual prejudice, irrespective of when they were born. For instance, a 50‐year‐old in 2014 would report the same levels and rate of change in sexual prejudice as a 50‐year‐old in 2024.
Egalitarian socialization
Although normative ageing has been a dominant explanation for generational differences in prejudice over the past decades, an alternative perspective suggests that the differences between younger and older generations reflect distinct socialization experiences (Zubielevitch et al.,2023). That is, social shifts which emphasize the importance of LGBTQIA+ rights are anticipated to impact people's sexual prejudice. In particular, the 1960s‐80s reflect a period of heightened proliferation of LGBTQIA+ rights, especially in New Zealand (i.e., the location of the present study). Of note is the formation of gay social clubs (1960s), LGBTQIA+ liberation groups (1970s), pro‐LGB+ protests (1970s‐80s), the first pride event (1972) and the decriminalization of homosexuality (1986). After this initial period of progress, Western democracies have continued to pass progressive legislation on civil union, same‐sex marriage, adoption, blood donations and conversion therapy (Brickell,2020; Hansen,2023; Neilson,2022; Saxton,2020). Because the political and social environment following the expansion of LGBTQIA+ rights is markedly different from prior decades (Hansen,2023), cohorts who came of age during this period should notably differ from those raised in a different zeitgeist in their endorsement of sexual prejudice. Whether these cohort differences emerge in their initial mean levels (e.g., period effect) or their rates of change (e.g., cohort effect) in sexual prejudice, however, remains unknown.
Period effects
One way in which socialization could contribute to generational differences in sexual prejudice is through period effects. Indeed, numerous scholars argue that prejudiced attitudes are continuously updated in response to changes in group norms (Álvarez‐Benjumea,2025; Arnold et al.,2026; Crandall et al.,2018; Sherif & Sherif,1953). For example, the lifelong openness model argues that attitude stability in older cohorts is not due to an inability to change, but rather, lifestyle constraints provide feweropportunitiesfor change (Miller & Sears,1986; Sears,1983; Tyler & Schuller,1991). Accordingly, when exposed to discrepant experiences or social norms, older cohorts change their attitudes to reflect the new norm, often at the same rate as their younger counterparts (Miller & Sears,1986; Tyler & Schuller,1991). Consistent with this perspective, the legalization of same‐sex relationships predicted an increase in acceptance of the LGBTQIA+ community in Canada (Matthews,2005) and numerous countries across Europe (Aksoy et al.,2020). A growing scholarship (e.g., Brown & Paterson,2016) also reveals that positive exposure to LGBTQIA+ people in the media predicts declines in sexual prejudice via vicarious contact in both the US (Preuß & Steffens,2021) and Italy (Vezzali et al.,2015). Taken together, these studies suggest that, although cohorts may have different initial mean levels of sexual prejudice, they should exhibit the same trajectory of change in sexual prejudice over time (i.e., a period effect) due to shared social conditions and conformity to new group norms. Fully explicating this possibility, however, requires longitudinal data that adjusts for normative ageing and cohort effects.
Cohort effects
Whereas a period effect assumes prejudiced attitudes are malleable across time, a divergent scholarship argues that prejudices are developed and crystallized in people's formative years. Indeed, the impressionable years' hypothesis posits that prejudiced attitudes are most pliable during childhood and early adulthood but become rigid thereafter (Alwin et al.,1991; Osborne et al.,2011; Sears,1981). As such, the environment and group norms that people were exposed to in their formative years are expected to have a lasting impact on their prejudiced attitudes. In the case of sexual prejudice, older generations were raised when homosexuality was criminalized, and sexual prejudice was normalized (Hansen,2023). In contrast, younger cohorts were socialized with the proliferation of legal and social protections for LGBTQIA+ people (Clarke et al.,2025; Hansen,2023). If attitudes do crystallize in early adulthood, then older cohorts should be more prejudiced and stable in their attitudes over time, compared with younger cohorts. Accordingly, Kreitzer et al. (2014) found that younger people are more likely than older people to increase their support for same‐sex marriage following its legalization in the US. Likewise, Clarke, Lilly, et al. (2026) examined the trajectory of support for same‐sex relationships across 14 years and revealed that, although the New Zealand population is increasing in support for same‐sex relationships, older participants were slower to change than their younger counterparts. Consistent with the impressionable years' hypothesis, these findings indicate that older cohorts may have already cemented their attitudes towards the LGBTQIA+ community and are thus more resistant than their younger counterparts to change over time.
Gender differences in sexual prejudice over time
In addition to generational differences, the growth trajectory of sexual prejudice may differ among men and women. Indeed, it is well documented that men are higher in sexual prejudice than women (Herek,1988; Kite & Whitley,1996,1997; LaMar & Kite,1998). Kite and Whitley (1997) argue that heterosexual men are higher in sexual prejudice because LGBTQIA+ identities threaten traditional forms of masculinity and the associated social hierarchy that places men above women and sexual minorities. In other words, heterosexual men (but not women) are expected to condemn LGBTQIA+ identities because doing so emphasizes their masculinity and power within the patriarchy.
A related literature demonstrates that the socialization of masculine norms during men's formative years is particularly rigid and, therefore, may undermine changes in sexual prejudice over time (Pascoe,2005; Poteat & Anderson,2012). In contrast, women are socialized with feminine gender roles which are (relatively) more flexible and, thus, open to change over time (LaMar & Kite,1998; Poteat & Anderson,2012). Consistent with this thesis, Poteat and Anderson (2012) reveal that adolescent boys showed no significant changes in their attitudes towards gay men over time despite declines in adolescent girls' sexual prejudice. Thus, men will likely display higher levels and slower rates of change in sexual prejudice than women. Prior work on the developmental trends in sexual prejudice among men and women has, however, exclusively focused on adolescence (e.g., Poteat & Anderson,2012). As such, it remains unknown how sexual prejudice develops across the full adult lifespan (e.g., 18–84 years).
THE CURRENT STUDY
In sum, there are three competing explanations for the generational differences in sexual prejudice: ageing, period and cohort differences. Elucidating these developmental trajectories is, however, difficult given that ageing, cohort and period effects unfold simultaneously. Indeed, properly separating the unique contribution of these processes requires age‐specific longitudinal data where participants comprise distinct generations and each generational cohort overlaps in age (O'Donnell et al.,[in press](#ref-in press); Prinzie & Onghena,2005; Zubielevitch et al.,2023). Notably, these data must differentiate between cohorts who came of age with the expansion of LGBTQIA+ rights and those who did not. Perhaps due to the difficulty in obtaining large‐scale longitudinal panel data that spans meaningful social change, no research to date has explicated how sexual prejudice develops across the adult lifespan for distinct cohorts.
The current pre‐registered study addresses this oversight by leveraging 11 annual waves of longitudinal panel data (2014–2024) from New Zealand to perform a cohort‐sequential latent growth curve model. This analytical approach allows us to separate ageing and societal trajectories by examining the rate of change in sexual prejudice among 12 different birth cohorts spanning 1995–1936 (ages 19–84). More specifically, we estimate three separate cohort‐sequential latent growth curve models that make different assumptions about the developmental trends of sexual prejudice over time. These models assume that sexual prejudice reflects (a) normative development across the lifespan (ageing effect), (b) a general trend across time among birth cohorts (period effect) or (c) differences between birth cohorts due to the distinct social context in which each birth cohort reached maturity (cohort effects). Due to the documented differences in the mean levels and rates of change in sexual prejudice between men and women (Kite & Whitley,1997; Poteat & Anderson,2012), we also examine whether there are gender differences in the trajectory of sexual prejudice across time. Importantly, this approach will allow us to clarify whether the trajectories of sexual prejudice are different among groups who experienced substantially different forms of gender role socialization.
Hypotheses
Although there are competing explanations for how sexual prejudice develops over the adult lifespan, the impressionable years hypothesis has (arguably) received the most support over the recent decades (e.g., Poteat & Anderson,2012). Thus, given that prejudiced attitudes are shaped by social norms (Matthews,2005), particularly those present during people's impressionable years (Alwin et al.,1991; Osborne et al.,2011; Sears,1981), we expect to find cohort‐based differences in sexual prejudice over time for women and men (Hypothesis 1). To elaborate, since the early 1960s, there has been a remarkable rise in LGB+ rights movements and legislation (e.g., the same‐sexMarriage Amendment Actin 2013). These events should have a unique impact on cohorts who witnessed this proliferation of LGB+ rights as they came of age. Additionally, because men (vs women) are typically higher on sexual prejudice (Herek,1988; Kite & Whitley,1997) and more resistant to change (Poteat & Anderson,2012), we expect that men of all cohorts will exhibit higher mean levels and slower rates of change in sexual prejudice over time than women (Hypothesis 2).
METHODS
Data and materials
The design and analysis for the current study were pre‐registered1on the Open Science Framework (OSF):https://osf.io/x4mb5. Data for the current study came from the New Zealand Attitudes and Values Study (NZAVS). The NZAVS was approved by the University of Auckland Human Participants Ethics Committee (reference number: UAHPEC22576), and informed consent was given by participants. Participants' responses are anonymised and confidential. Our ethics approval specifies that we are unable to post our dataset online—doing so would violate the conditions of our ethics approval. However, a de‐identified dataset containing the variables analysed in this manuscript is available upon request from the corresponding author or any NZAVS advisory board member for replication purposes. The Mplus syntax used for all models reported in this study is also available on the OSF:https://osf.io/dz92p.
Sampling procedure
The NZAVS is an ongoing longitudinal panel study of New Zealand adults that began in 2009. Participants were initially sampled from the New Zealand electoral roll (Time 1;N= 6518; response rate = 16.6%). Importantly, because voter registration is compulsory in New Zealand, this sample effectively constitutes a random sample of New Zealand adults. To address sample attrition and diversify the sample, nine additional booster samples were recruited in 2011 (Time 3;N= 6884,nbooster = 2966), 2012 (Time 4;N= 12,179,nbooster = 5107), 2013 (Time 5;N= 18,261,nbooster = 7487), 2016 (Time 8;N= 21,936,nbooster = 7667), 2018 (Time 10;N= 47,948,nbooster = 29,921), 2019 (Time 11;N= 42,681,nbooster = 4734), 2021 (Time 13;N= 34,131,nbooster = 1301), 2022 (Time 14;N= 33,722,nbooster = 1574) and 2023 (Time 15;N= 32,857,nbooster = 3293). At Time 16, the sample size was 31,873 (70.27% retention from Time 15; 28.34% retention from Time 1). Sibley (2024) provides a full overview of the sampling procedure, booster sampling, ethics and retention rates (see the OSF:https://osf.io/75snb/).
Participant details
The current study focuses on the 63,558 participants who provided partial or complete responses to our focal variables at one or more assessment occasions (see Table1). Of these participants, 37.0% identified as men (n= 23,514), 63.0%% identified as women (n= 40,044). Concerning ethnicity, 78.2% identified as New Zealand European (n= 49,733), 12.4% as Māori (n= 7902), 2.6% as Pacific Nations ancestry (n= 1629), 5.3% as Asian ancestry (n= 3348) and 1.5% did not report their ethnicity (n= 946). The mean age of the sample was 46.68 (SD= 13.23) at Time 6 (i.e., the first assessment of sexual prejudice and, thus, the start of our study).
Table: Age and sample size for birth cohorts.
Materials
All measures were embedded within a larger omnibus survey containing measures outside the scope of the present study.
Sexual Prejudicewas assessed with a single item adapted from Pew Research Center (2008): “I think that homosexuality should be accepted by society” (reverse‐coded). This item is measured on a 1 (strongly disagree) to 7 (strongly agree) scale and was added to the NZAVS at Time 6 (i.e., in 2014).
Genderwas assessed with an open‐ended item: “What is your gender?”. Gender was then coded into a dichotomous variable according to a scheme developed by the NZAVS (0 = woman, 1 = man; see Fraser et al.,2020). Although this open‐ended measure was developed as a gender‐inclusive way for participants to self‐identify with their preferred label(s), less than 1.0% of participants self‐identified as transgender, non‐binary or gender diverse (TGD). This sample size of TGD participants is, therefore, too small to be included in our analytic approach. As such, we focus on participants who consistently self‐identify as a “man” or “woman”. Nevertheless, because many members of the community do not self‐identify as transgender (i.e., self‐report as “man” or “woman”; see Fraser et al.,2020; Lilly et al.,2023), we are unable to distinguish between cisgender and binary transgender participants.
Analytic approach
To examine whether changes in sexual prejudice are due to normative ageing, societal shifts or generational differences and whether these changes differed by men and women, we conducted a multi‐group cohort sequential latent growth curve model based on 5‐year birth cohorts inMplusversion 8.10 with full information maximum likelihood (FIML) estimation to account for missing data (also see Lilly et al.,2025; Zubielevitch et al.,2023). Like a latent growth model, a cohort sequential latent growth curve model estimates developmental trajectories over time. The cohort sequential latent growth curve model, however, extends the traditional approach by simultaneously estimating the intercepts and slopes of sexual prejudice for different cohorts. More specifically, we can estimate three cohort‐sequential models with different constraints to examine if changes in sexual prejudice reflect normative ageing (ageing effect), a general trend across time among birth cohorts (period effect) or differences between birth cohorts (cohort effect). By overlapping the estimates for each birth cohort, we can reveal common developmental trends and potential differences between cohorts across time.
We sort our sample into 5‐year birth cohorts based on their year of birth, with a total of 12 different birth cohorts spanning 1995–1936 (ages 19–84). We use the youngest possible age within each cohort as an indicator of age at Time 6 (i.e., our first assessment occasion, 2014). As such, the growth trajectories for each cohort reflect normative ageing across 10 years and changes from 2014 to 2024. In other words, the 1995–1990 birth cohort reflected 10 years of changes from ages 19–29, the 1990–1986 birth cohort reflected changes from ages 24–34 and so on. We also separated each birth cohort by gender to model separate trajectories in sexual prejudice for women and men.
We began by estimating an ageing model that assumes all generations, irrespective of when they were born, experience the same initial mean level and rate of change in sexual prejudice when they are the same age. That is, a 50‐year‐old at Time 6 (2014) would report the same levels and rate of change in sexual prejudice as a 50‐year‐old at Time 16 (2024). As such, we constrained all intercepts and slopes to equality across all birth cohorts. Importantly, to account for curvilinear change over time, we estimated both linear and quadratic components in our analyses. This model was centred at the mid‐point of our age range of interest (i.e., 45‐years) and conditioned by age to allow us to plot the point estimates of sexual prejudice on a continuum from ages 19–84. In doing so, we graphed the common growth trajectory in sexual prejudice across the adult lifespan by allowing each birth cohort to contribute to a different segment of the curve.
To account for the possibility that differences in sexual prejudice are due to societal trends, we then estimated a period model. The period model assumes that all birth cohorts differ in their initial mean level of sexual prejudice. But, due to shared social conditions (e.g., the legalization of same‐sex marriage), each birth cohort will exhibit the same rate of change in sexual prejudice over time. As such, we constrained the slopes but allowed the intercepts to vary across cohorts.
Finally, we estimated a cohort model that assumes that each birth cohort will differ in their initial mean and rate of change in sexual prejudice over time due to the different societal conditions under which each birth cohort reached maturity. In other words, those who came of age in the 1940s will exhibit substantially different mean levels of, and rates of change in, sexual prejudice than those who came of age in the 1990s because of the unique experiences (e.g., LGB+ rights movements or lack thereof) that occurred during each birth cohort's formative developmental years. As such, the intercepts and slopes were free to vary across cohorts. Like the ageing model, we conditioned the estimates by age in years to plot the trends for each birth cohort's age across the 11 annual assessment occasions. Accordingly, the growth trajectories for sexual prejudice for one birth cohort at the first half of their assessment points overlap with the previous birth cohort at the last half of their assessment points. Therefore, we can examine if the 95% error bars from these estimates overlap across the birth cohort; overlapping error bars would indicate that differences in sexual prejudice are attributable to normative ageing. In contrast, nonoverlapping error bars suggest distinct cohort differences in sexual prejudice.
To determine if changes in sexual prejudice reflect an ageing, period or cohort effect, we first compare the global fit statistics of the three models. These fit statistics include the comparative fit statistics (CFI; Wang & Wang,2012), the standardized root mean squared residual (SRMR; Hu & Bentler,1999), and the root mean square error of approximation (RMSEA; McDonald & Ho,2002). We also report the Akaike Information Criterion (AIC), the Bayesian Information Criterion (BIC) and the sample‐size adjusted BIC (aBIC), whereby lower values indicate a better model fit (Muthén & Muthén,2000). Finally, we report the chi‐squared test statistic, but its sensitivity to large samples renders it an impractical test of model fit (Wang & Wang,2012). Because these fit statistics cannot fully elucidate important distinctions between ageing and cohort effects (Steiger,2007), we also plot the estimates for the ageing and birth cohorts' models by age to visually inspect whether these estimates reflect normative ageing, cohort differences, or period effects.
RESULTS
Ageing model
Except for the SRMR (SRMR = 0.107), the ageing model fit these data well,χ2(1839) = 24163.409,p< .001, CFI = .917, RMSEA = 0.068. Given that the SRMR deviates only slightly from conventional standards and that all other fit indices meet conventional cutoffs, we retain the ageing model. Consistent with this analytical choice, many scholars argue that the conventional cutoff standards proposed by Hu and Bentler (1999) are too stringent for complex models and should thus be used as guidelines rather than strict rules (Nye,2023). With this in mind, the parameter estimates that best fit all birth cohorts are displayed in Table2. For women, the ageing model suggests a curvilinear decrease in sexual prejudice (s= 0.009,SE= 0.005,p= .116;q= −0.024,SE= 0.003,p< .001; see Table3). Indeed, the black line displayed in Figure1reveals that sexual prejudice slowly increased from age 19 until approximately age 40, where it stabilized until approximately age 60 before slowly declining until age 84. Turning to our results for men, sexual prejudice had a significant linear increase (s= 0.063,SE= 0.08,p< .001; see Table3) that slowed over time (q= −0.034,SE= 0.003,p< .001). Similar to women, Figure2shows that men's sexual prejudice slowly increased from age 19 until approximately age 50 before declining thereafter.
Table: Model fit for ageing, period and cohort models.
Table: Parameter coefficients for the ageing model.
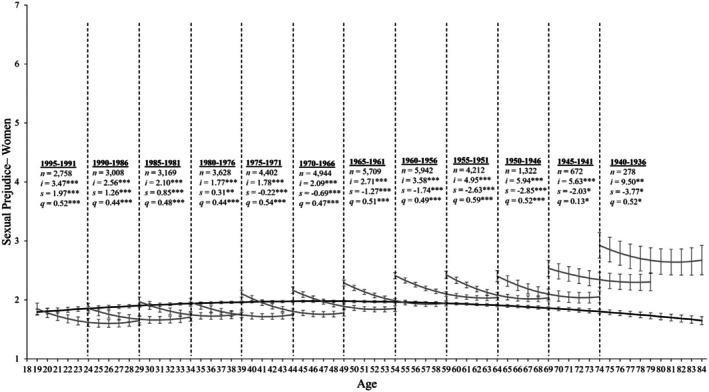
*Change trajectories and comparison of ageing and cohort models for women's sexual prejudice. Change trajectories for women's sexual prejudice are shown in the back line from ages 18–84. The grey lines within each 5‐year birth cohort panel demonstrate longitudinal change in sexual prejudice over 11 assessments by estimating the latent intercept (i), linear slopes (s) and quadratic slopes (q) and overlap with subsequent birth cohorts by 6 years. The estimations are based on mean levels of sexual prejudice shown on the y‐axis across age (in years) and assessments (annual) on the x‐axis, with 95% confidence intervals as error bars around each point estimate. All birth cohorts show significant rates of change. *p≤ .05, **p≤ .01, **p≤ .001.
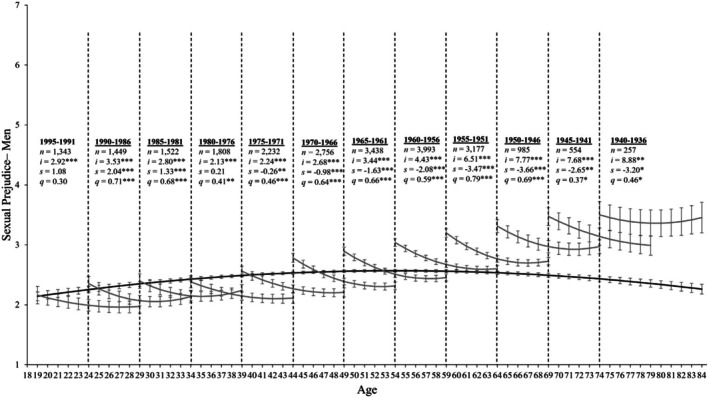
*Change trajectories and comparison of ageing and cohort models for men's sexual prejudice. Change trajectories for men's sexual prejudice are shown in the back line from ages 18–84. The grey lines demonstrate longitudinal change in sexual prejudice over 11 assessments by estimating the latent intercept (i), linear slopes (s) and quadratic slopes (q) and overlap with subsequent birth cohorts by 6 years. The estimations are based on mean levels of sexual prejudice shown on the y‐axis across age (in years) and annual assessments on the x‐axis, with 95% confidence intervals as error bars around each point estimate. Birth cohorts with significant rates of change are underlined for clarity. *p≤ .05, **p≤ .01, **p≤ .001.
Period model
The period model of sexual prejudice also fits these data well across all indices, but the SRMR once again fell slightly short of conventional standards,χ2(1816) = 20,780.234,p< .001, CFI = .930, RMSEA = 0.063, SRMR = 0.106. Table4reveals that the freely estimated intercepts were higher for each successive cohort of women and men. As such, older cohorts (e.g., those born in 1936) of men and women display a higher mean level of sexual prejudice than their younger counterparts (e.g., those born in 1995). The period model suggests a curvilinear decline in sexual prejudice over time for women (s= −0.243,SE= 0.009,p< .001;q= −0.014,SE= 0.003,p< .001) and men (s= −0.305,SE= 0.013,p< .001;q= −0.012,SE= 0.004,p= .005).
Table: Parameter estimates for the period model.
Cohort model
Finally, the cohort model for sexual prejudice fit these data well, except for the SRMR,χ2(1772) = 19,805.555,p< .001, CFI = 0.933, RMSEA = 0.062, SRMR = 0.106. For women, Table5reveals that all birth cohorts showed significant quadratic changes in sexual prejudice over time (ps < .005). More specifically, the grey lines in Figure1display the birth cohorts' trends across the 11 annual assessment occasions. A visual inspection reveals visible cohort differences (as shown by the nonoverlapping 95% error bars). In particular, the younger cohorts display lower levels of sexual prejudice than their older counterparts, but all cohorts declined in their sexual prejudice at a similar rate across 11 assessment occasions. Turning to our results for men, Table5reveals that 11 out of 12 birth cohorts displayed significant quadratic changes in sexual prejudice over time (ps < .005)—only the 1995–1991 cohort displayed stable rates over time (ps ≥ .097). Figure2displays the birth cohort trends across the 11 annual assessments for men. Like women, there are visible cohort differences (shown by the nonoverlapping 95% error bars) whereby younger cohorts exhibit a lower mean level of sexual prejudice than their older counterparts. Nevertheless, all cohorts show a decline in sexual prejudice that slows over time.
Table: Parameter estimates for the cohort model.
Given that ageing, period and cohort models all fit these data well, a combination of the processes likely contributes to the development of sexual prejudice. A visual inspection of the ageing and cohort effects in Figures1and2demonstrates that, although the cohort and ageing models overlap at points across the adult lifespan, this overlap is rare—particularly among the older cohorts (1960–1936). Moreover, there is minimal overlap between the cohorts for both men and women (as shown by the nonoverlapping 95% error bars), especially among the older cohorts. Although each cohort displays different initial mean levels of sexual prejudice, all cohorts display a similar rate of change in their sexual prejudice over time. This suggests that, rather than normative development, shared social conditions are likely responsible for the declines in sexual prejudice observed among men and women of all ages over time.
DISCUSSION
The current pre‐registered study utilized 11 annual waves of longitudinal panel data and cohort‐sequential latent growth curve modelling to examine the growth trajectories of sexual prejudice across the adult lifespan. In doing so, we are the first to illuminate whether the well‐known generational differences in sexual prejudice reflect a normative ageing process (e.g., Peterson et al.,2020; Wilson,1996) or cohort differences that emerge due to the different cultural zeitgeist in which each generation reached maturity (Crandall et al.,2018; Sherif & Sherif,1953). Given the importance of social norms in fostering prejudice (Aksoy et al.,2020; Matthews,2005) and the robust support for the impressionable years' hypothesis (Alwin et al.,1991; Osborne et al.,2011; Sears,1981), we anticipated to find cohort‐based differences in sexual prejudice (Hypothesis 1).
Consistent with the well‐established generational gap in sexual prejudice (Herek,2009; Herek & McLemore,2013), our results reveal that older generations have higher initial mean levels of sexual prejudice than their younger counterparts. At first blush, these results could be mistaken for normative ageing. However, the cohortandageing models rarely overlap, especially among older birth cohorts. Thus, as predicted, we reveal discernible cohort differences in sexual prejudice. Specifically, we show that cohorts differ in their initial mean levels of sexual prejudice. But, contrary to the impressionable years hypothesis, cohorts display comparable rates of change in sexual prejudice over time. These data suggest a clearperiod effectwith comparable and significant declines in sexual prejudice for all birth cohorts for women and 11 (out of 12) birth cohorts for men.
That the majority of cohorts are declining in their sexual prejudice, despite coming of age with vastly different group norms, affirms that people's attitudes are malleable across the adult life span (Crandall et al.,2018; Sherif & Sherif,1953). Thus, our results support the lifelong openness model (Sears,1983; Tyler & Schuller,1991) and norm‐based explanations of sexual prejudice (e.g., Álvarez‐Benjumea,2025; Crandall et al.,2018) to suggest that changes in shared social conditions provide all cohorts the opportunity to update their prejudices and conform to group norms. Therefore, elucidating the development of prejudiced attitudes requires a shift from rigid age‐based explanations towards a more flexible approach which accounts for changes in the broader socio‐political environment (also see Tyler & Schuller,1991). Doing so is particularly important as prejudiced norms wax and wane across time and space (Arnold et al.,2026; Crandall et al.,2018; Haas & Lannutti,2024).
Gender differences in sexual prejudice
We also examined potential gender differences in both the mean levels of, and rates of change in, sexual prejudice. As hypothesized, men reported higher mean levels of sexual prejudice than women. These results are consistent with the assumption that men are more motivated to endorse sexual prejudice because doing so emphasizes their masculinity and subsequent place in the social hierarchy (see Kite & Whitley,1997). Although we anticipated that men would also report slower rates of change in sexual prejudice than women (Hypothesis 2), we found that men and women display comparable rates of change in sexual prejudice across time. In this case, previous scholars have (most likely) overestimated the rigidity of masculine socialization and sexual prejudice across the adult lifespan (c.f., Poteat & Anderson,2012). Although beyond the scope of the present study, these results imply that (most) men are aware of the social sanctions for expressing sexual prejudice in the 21st century (Álvarez‐Benjumea,2025; Crandall et al.,2018) and, thus, adopt more progressive attitudes towards sexual minorities.
Strengths, policy implications and future research directions
By utilizing 11 annual waves of longitudinal panel data containing responses from over 60,000 participants, the current study provides the most comprehensive picture of the development of sexual prejudice across adulthood to date. Indeed, given that it is impractical, if not impossible, to obtain data spanning an entire lifetime, a cohort‐sequential latent growth curve model is the most effective approach to separating and comparing ageing, period and cohort effects across the adult life span (Lilly et al.,2025; Zubielevitch et al.,2023). Our exceptionally large sample size and unique analytic method also allow us to accurately identify meaningful, albeit small, effects that would otherwise be unreliable in an underpowered study (Götz et al.,2022). And although they require careful interpretation, “small” effects are becoming the norm in psychology—especially when charting the lifespan development of complex attitudes (Götz et al.,2022). For example, prior research utilizing the same dataset and analytic approach reveals comparable effect sizes when assessing the developmental trajectories of right‐wing authoritarianism and social dominance orientation (Zubielevitch et al.,2023), individual‐ and group‐based relative deprivation (Lilly et al.,2025), Gender Identity Centrality (Hill Cone et al.,2025) and climate change beliefs (Milfont et al.,2021). Thus, this analytic strategy clarifies for the first time that initial mean levels—but not the trajectory—of sexual prejudices differ among cohorts and genders. Our results thus highlight the lifetime malleability of sexual prejudice and raise important implications and future research directions for the sexual prejudice literature.
Practically, (even small) declines in sexual prejudice across cohorts can translate to important political consequences (also see Götz et al.,2022). Not long ago, same‐sex marriage was a ‘hot button issue’, and politicians were reluctant to support LGBTQIA+ rights (Baunach,2012). Numerous politicians, including former U.S. President Barack Obama, argued that their initial opposition to LGBTQIA+ rights was not reflective of their personal values, but rather, was because same‐sex marriage was a political non‐starter (McCarthy,2015). However, the decline in sexual prejudice across cohorts observed here suggests that public support for the LGB+ community is politically advantageous in 2026. Consistent with this perspective, members of the National Party (e.g., New Zealand's centre‐right party) directly attribute their recent support for same‐sex marriage to the discernible decline in sexual prejudice among New Zealanders (Yeoman,2019). We, therefore, caution against prematurely dismissing small declines in sexual prejudice, and reassure politicians that support for LGBTQIA+ rights is not only tolerated but expected—at least among New Zealanders.
Although our cohort‐sequential latent growth curve model captures amean‐leveldecline in sexual prejudice across cohorts of men and women, multiple conservative governments, including the Trump administration, were recently elected despite their political campaigns being centred on censoring LGBTQIA+ activism and erasing LGBTQIA+ history (Arnold et al.,2026; Crandall et al.,2018). Likewise, despite ostensible trends towards egalitarianism, New Zealand has witnessed an unprecedented rise in anti‐LGBTQIA+ protests and hate crimes in recent years (Daalder,2022). Therefore, (at least) a small subgroup of the population remains high or is increasing in their sexual prejudice across time. For instance, although trajectories in sexual prejudice may not vary by generational cohort or gender, they may differ as a function of other demographics (e.g., religiosity) and ideology (political conservatism). We strongly encourage future scholars to employ person‐centred analysis, such as Latent Class Growth Curve analysis, to elucidate the (potentially) heterogeneous growth trajectories in sexual prejudice, as well as the socio‐demographic factors which may influence their rates of change over time.
It is also worth noting that, because we utilize a single‐item measure of sexual prejudice, we cannot capture the different components of prejudice nor perform measurement invariance tests over time. Thus, responses to our item could reflect changes in the normative climate or reinterpretation of our item rather than enduring changes in affect, cognition, or behaviour towards the LGB+ community. For example, some cohorts may feel disgust (affective component), act violently (behavioural component) or endorse negative stereotypes (the cognitive component) towards sexual minorities but understand that it is socially inappropriate to express these prejudices. Although it may be tempting to dismiss our findings on these grounds, the different components of sexual prejudice are highly correlated. Indeed, those who self‐report acceptance of homosexuality are also likely to vote for pro‐LGB+ policies and feel warm towards their LGB+ peers (Chonody,2013; Clarke, Sibley, et al.,2026; Herek,2009). Additionally, our single item has high face validity and is a well‐utilized measure of sexual prejudice across cultures (Poushter & Kent,2020). Our results thus indicate that cohorts are sensitive to changes in social norms and, at the very least, adjust their explicit attitudes accordingly. In other words, although we cannot ascertain if our results reflect a true change in people's hearts, they do indicate an important change in people's minds.
Despite drawing on an exceptionally large sample of over 60,000 people, there are three sample constraints worth considering. First, supplementary analysis reveals some evidence of selective attrition (see TableS1in the Online Supplementary Materials). Although it is important to acknowledge selective attrition in longitudinal panel studies (Satherley et al.,2015), it is unlikely to produce the complex pattern of results observed here (see OSM for further discussion). Second, our sample of TGD participants was too small to be included in our multi‐group analyses. This sample constraint is particularly unfortunate, considering the growing calls to examine TGD people as political actors who hold unique attitudes towards LGB+ issues (Egan,2025). For instance, given that TGD people typically report more acceptance of LGB+ people than their cisgender counterparts (Fisher et al.,2017), cohorts of TGD people likely display distinct initial mean levels and growth trajectories of sexual prejudice. Finally, we overrepresent women in the current study. Although this gender imbalance is mitigated by our multi‐group analysis which estimated the growth trajectories separately for men and women, future research would benefit from a more representative sample of genders, including an explicit exploration of TGD people's sexual prejudice.
Finally, future research should investigate the mechanism(s) responsible for the decline in sexual prejudice across cohorts. Although we attribute the declines in sexual prejudice to changes in shared social conditions and norms, we cannot directly determine what catalysed these changes. That is, our analysis revealswhenchange occurs, but notwhy. Given that policy implementation is a powerful driver of social norms (Álvarez‐Benjumea,2025), it is possible that the recent passage of progressive policies facilitated the decline in sexual prejudice across cohorts and genders observed here. Consistent with this perspective, emerging research reveals that support for same‐sex marriage precedes declines in sexual prejudice for some groups in New Zealand (Clarke, Sibley, et al.,2026). Alternatively, pro‐LGB+ norms may be achieved through incremental steps and the cumulative efforts of activists and politicians over the past decades. Although beyond the scope of the present study, elucidating exactlywhysexual prejudice is declining over time is essential to understanding when and how people will adopt progressive attitudes towards sexual minorities.
CONCLUSION
The current study examined whether generational differences in sexual prejudice reflect a process of normative ageing or differences across cohorts. Specifically, we leveraged 11 annual waves of longitudinal panel data to conduct a series of cohort‐sequential latent growth curve models that test for ageing, period and cohort effects in sexual prejudice across the adult life span (i.e., 19–84 years of age) among men and women. Although our results reveal that cohorts and genders displayed different initial mean levels of sexual prejudice, almost all cohorts declined in sexual prejudice at a similar rate over time. Thus, despite the assumed rigidity of attitudes later in life (Alwin et al.,1991; Osborne et al.,2011), our results indicate that sexual prejudice remains malleable across the lifespan for both men and women. As such, we echo scholars' optimism for the future of LGBTQIA+ rights and argue that changes in shared social conditions can facilitate a decline in sexual prejudice across cohorts and genders.
AUTHOR CONTRIBUTIONS
EVC: Conceptualization (lead), Formal analysis, Writing – original draft (lead), Writing – review & editing, Funding Acquisition, visualization.CGS: Conceptualization (supporting), Data Curation, Funding Acquisition, Writing – review and editing, Supervision.DO: Conceptualization, Writing – original draft (supporting), Supervision.
CONFLICT OF INTEREST STATEMENT
The authors confirm that we have no potential financial or non‐financial conflicts of interest to declare.
References
- Aksoy, C. G. , Carpenter, C. S. , De Haas, R. , &Tran, K. D. (2020). Do laws shape attitudes? Evidence from same‐sex relationship recognition policies in Europe. European Economic Review, 124, 103399. doi.org/10.1016/j.euroecorev.2020.103399
- Álvarez‐Benjumea, A. (2025). Social norms and the expression of prejudice: How the norm changes. Current Opinion in Psychology, 62, 101974. doi.org/10.1016/j.copsyc.2024.101974
- Alwin, D. F. , Cohen, R. L. , &Newcomb, T. M. (1991). Political attitudes over the life span: The Bennington study. University of Wisconsin Press.
- Arnold, S. E. , Chavez, J. W. , Swanson, K. S. , &Crandall, C. S. (2026). Changing norms following the 2024 U. S. presidential election: The Trump effect on prejudice redux. Personality and Social Psychology Bulletin, 1461672251411348. doi.org/10.1177/01461672251411348
- Baunach, D. M. (2012). Changing same‐sex marriage attitudes in America from 1988 through 2010. Public Opinion Quarterly, 76(2), 364–378. doi.org/10.1093/poq/nfs022
- Brickell, C. (2020). A short history of same‐sex marriage in New Zealand. Sexualities, 23(8), 1417–1433. doi.org/10.1177/1363460720902713
- Brown, R. , &Paterson, J. (2016). Indirect contact and prejudice reduction: Limits and possibilities. Current Opinion in Psychology, 11, 20–24. doi.org/10.1016/j.copsyc.2016.03.005
- Chonody, J. M. (2013). Measuring sexual prejudice against gay men and lesbian women: Development of the sexual prejudice scale (sps). Journal of Homosexuality, 60(6), 895–926. doi.org/10.1080/00918369.2013.774863
- Clarke, E. V. , Lilly, K. J. , Osborne, D. , Hill Cone, D. , Fluit, S. , Simionato, N. M. , Sibley, C. G. , &Barlow, F. K. (2025). A naturalistic test of minority stress theory: Examining social and psychological well‐being trends across heterosexual and sexual minority adults from 2009 to 2022. The Journal of Sex Research, 63, 1–13. doi.org/10.1080/00224499.2025.2458636
- Clarke, E. V. , Lilly, K. J. , Sibley, C. G. , &Osborne, D. (2026). Examining the typologies of change in support for the Civil Union Act and same‐sex marriage over fourteen years (2009–2023).
- Clarke, E. V. , Sibley, C. G. , &Osborne, D. (2026). Sexual prejudice predicts opposition to marriage equality for men and women. Journal of Homosexuality, 73(2), 414–436. doi.org/10.1080/00918369.2025.2475032
- Crandall, C. S. , Miller, J. M. , &White, M. H. (2018). Changing norms following the 2016 U. S. presidential election: The Trump effect on prejudice. Social Psychological and Personality Science, 9(2), 186–192. doi.org/10.1177/1948550617750735
- Daalder, M. (2022). A new wave of anti‐LGBT hate. News Room.
- Egan, P. J. (2025). Centering LGBTQ+ political behavior in political science. PS: Political Science & Politics, 58(3), 438–446. doi.org/10.1017/S1049096524001288
- Equaldex. (2025). Explore the progress of LGBTQ+ rights across the world. Equaldex.
- Fisher, A. D. , Castellini, G. , Ristori, J. , Casale, H. , Giovanardi, G. , Carone, N. , Fanni, E. , Mosconi, M. , Ciocca, G. , Jannini, E. A. , Ricca, V. , Lingiardi, V. , &Maggi, M. (2017). Who has the worst attitudes toward sexual minorities? Comparison of transphobia and homophobia levels in gender dysphoric individuals, the general population and health care providers. Journal of Endocrinological Investigation, 40(3), 263–273. doi.org/10.1007/s40618-016-0552-3
- Fraser, G. , Bulbulia, J. , Greaves, L. M. , Wilson, M. S. , &Sibley, C. G. (2020). Coding responses to an open‐ended gender measure in a New Zealand national sample. Journal of Sex Research, 57(8), 979–986. doi.org/10.1080/00224499.2019.1687640
- Götz, F. M. , Gosling, S. D. , &Rentfrow, P. J. (2022). Small effects: The indispensable foundation for a cumulative psychological science. Perspectives on Psychological Science, 17(1), 205–215. doi.org/10.1177/1745691620984483
- Haas, S. M. , &Lannutti, P. J. (2024). “They are giving folks permission to discriminate and hate”: A 4‐year longitudinal analysis of perceived impact of the Trump administration on LGBTQ + individuals and relationships, 2017–2020. Sexuality Research & Social Policy, 21(1), 62–75. doi.org/10.1007/s13178-023-00843-x
- Hansen, W. (2023). A history of pride in Aotearoa New Zealand.
- Herek, G. M. (1988). Heterosexuals' attitudes toward lesbians and gay men: Correlates and gender differences. The Journal of Sex Research, 25(4), 451–477. doi.org/10.1080/00224498809551476
- Herek, G. M. (2009). Sexual prejudice. InT. D. Nelson(Ed. ), Handbook of prejudice, stereotyping, and discrimination(pp. 441–467). Taylor & Francis Group, LLC.
- Herek, G. M. , &McLemore, K. A. (2013). Sexual Prejudice. Annual Review of Psychology, 64, 309–333. doi.org/10.1146/annurev-psych-113011-143826
- Hill Cone, D. , Zubielevitch, E. , Sibley, C. G. , &Osborne, D. (2025). Gender identity is becoming more central to women of all ages, but less central to young men. Current Research in Ecological and Social Psychology, 9, 100242. doi.org/10.1016/j.cresp.2025.100242
- Hu, L. , &Bentler, P. M. (1999). Cutoff criteria for fit indexes in covariance structure analysis: Conventional criteria versus new alternatives. Structural Equation Modeling: A Multidisciplinary Journal, 6(1), 1–55. doi.org/10.1080/10705519909540118
- ILGA. (2025). ILGA Database World.
- Jost, J. T. , Napier, J. L. , Thorisdottir, H. , Gosling, S. D. , Palfai, T. P. , &Ostafin, B. (2007). Are needs to manage uncertainty and threat associated with political conservatism or ideological extremity?Personality and Social Psychology Bulletin, 33(7), 989–1007. doi.org/10.1177/0146167207301028
- Kite, M. E. (2011). (Some) things are different now: An optimistic look at sexual prejudice. Psychology of Women Quarterly, 35(3), 517–522. doi.org/10.1177/0361684311414831
- Kite, M. E. , &Whitley, B. E. (1996). Sex differences in attitudes toward homosexual persons, behaviors, and civil rights a meta‐analysis. Personality and Social Psychology Bulletin, 22(4), 336–353. doi.org/10.1177/0146167296224002
- Kite, M. E. , &Whitley, B. E. (1997). Do heterosexual women and men differ in their attitudes toward homosexuality? A conceptual and methodological analysis. InG. M. Herek(Ed. ), Stigma and sexual orientation: Understanding prejudice against lesbians, gay men and bisexuals(Vol. 4, pp. 39–61). SAGE Publications, Incorporated. doi.org/10.4135/9781452243818.n3
- Kreitzer, R. J. , Hamilton, A. J. , &Tolbert, C. J. (2014). Does policy adoption change opinions on minority rights? The effects of legalizing same‐sex marriage. Political Research Quarterly, 67(4), 795–808. doi.org/10.1177/1065912914540483
- LaMar, L. , &Kite, M. (1998). Sex differences in attitudes toward gay men and lesbians: A multidimensional perspective. The Journal of Sex Research, 35(2), 189–196. doi.org/10.1080/00224499809551932
- Lilly, K. J. , Satherley, N. , Sibley, C. G. , Barlow, F. K. , &Greaves, L. M. (2023). Fixed or fluid? Sexual identity fluidity in a large national panel study of New Zealand adults. The Journal of Sex Research, 61, 1–16. doi.org/10.1080/00224499.2023.2289517
- Lilly, K. J. , Sibley, C. G. , &Osborne, D. (2025). Perceived relative deprivation across the adult lifespan: An examination of aging and cohort effects. Personality and Social Psychology Bulletin, 51(4), 554–572. doi.org/10.1177/01461672231195332
- Matthews, J. S. (2005). The political foundations of support for same‐sex marriage in Canada. Canadian Journal of Political Science, 38(4), 841–866. doi.org/10.1017/S0008423905040485
- McCarthy, T. (2015). Obama's gay marriage controversy: ‘I am just not very good at bullshitting’. The Guardian.
- McDonald, R. P. , &Ho, M. ‐H. R. (2002). Principles and practice in reporting structural equation analyses. Psychological Methods, 7(1), 64–82. doi.org/10.1037/1082-989X.7.1.64
- McInroy, L. B. , &Shelley, L. (2017). Perspectives of LGBTQ emerging adults on the depiction and impact of LGBTQ media representation. Journal of Youth Studies, 20(1), 32–46. doi.org/10.1080/13676261.2016.1184243
- Milfont, T. L. , Zubielevitch, E. , Milojev, P. , &Sibley, C. G. (2021). Ten‐year panel data confirm generation gap but climate beliefs increase at similar rates across ages. Nature Communications, 12(1), 4038. doi.org/10.1038/s41467-021-24245-y
- Miller, S. D. , &Sears, D. O. (1986). Stability and change in social tolerance: A test of the persistence hypothesis. American Journal of Political Science, 30(1), 214–236. doi.org/10.2307/2111302
- Muthén, B. , &Muthén, L. K. (2000). Integrating person‐centered and variable‐centered analyses: Growth mixture modeling with latent trajectory classes. Alcoholism: Clinical and Experimental Research, 24(6), 882–891. doi.org/10.1111/j.1530-0277.2000.tb02070.x
- Neilson, M. (2022). Bill to ban conversion therapy passes second reading, just seven National MPs now opposed. The New Zealand Herald.
- Nölke, A. ‐I. (2018). Making diversity conform? An intersectional, longitudinal analysis of LGBT‐specific mainstream media advertisements. Journal of Homosexuality, 65(2), 224–255. doi.org/10.1080/00918369.2017.1314163
- Nye, C. D. (2023). Reviewer resources: Confirmatory factor analysis. Organizational Research Methods, 26(4), 608–628. doi.org/10.1177/10944281221120541
- O'Donnell, A. W. , Kotzur, P. F. , &Lilly, K. J. (2026). Latent growth modelling. InEncyclopedia of measurement in social sciences. Elsevier.
- Osborne, D. , Sears, D. O. , &Valentino, N. A. (2011). The end of the solidly democratic south: The impressionable‐years hypothesis. Political Psychology, 32(1), 81–108. doi.org/10.1111/j.1467-9221.2010.00796.x
- Pascoe, C. J. (2005). ‘Dude, You're a Fag’: Adolescent masculinity and the fag discourse. Sexualities, 8(3), 329–346. doi.org/10.1177/1363460705053337
- Peterson, J. C. , Smith, K. B. , &Hibbing, J. R. (2020). Do people really become more conservative as they age?The Journal of Politics, 82(2), 600–611. doi.org/10.1086/706889
- Poteat, V. P. , &Anderson, C. J. (2012). Developmental changes in sexual prejudice from early to late adolescence: The effects of gender, race, and ideology on different patterns of change. Developmental Psychology, 48(5), 1403–1415. doi.org/10.1037/a0026906
- Poushter, J. , &Kent, N. (2020). The global divide on homosexuality persists.
- Preuß, S. , &Steffens, M. C. (2021). A video intervention for every straight man: The role of preattitudes and emotions in vicarious‐contact effects. Group Processes & Intergroup Relations, 24(6), 921–944. doi.org/10.1177/1368430220910462
- Prinzie, P. , &Onghena, P. (2005). Cohort sequential design. InB. S. Everitt&D. C. Howell(Eds. ), Encyclopedia of statistics in behavioral science(Vol. 1, pp. 319–322). John Wiley. doi.org/10.1002/0470013192.bsa110
- Satherley, N. , Milojev, P. , Greaves, L. M. , Huang, Y. , Osborne, D. , Bulbulia, J. , &Sibley, C. G. (2015). Demographic and psychological predictors of panel attrition: Evidence from the New Zealand attitudes and values study. PLoS One, 10(3), e0121950. doi.org/10.1371/journal.pone.0121950
- Saxton, P. (2020). Changes to blood donor deferral in New Zealand 2020: Summary for the gay community.
- Sears, D. O. (1981). Life‐stage effects on attitude change, especially among the elderly. InS. B. Kiesler, J. N. Morgan, &V. K. Oppenheimer(Eds. ), Aging: Social change(pp. 183–204). Academic Press.
- Sears, D. O. (1983). The persistence of early political predispositions: The roles of attitude object and life stage. InL. Wheeler&P. Shaver(Eds. ), Review of personality and social psychology(Vol. 4, pp. 79–116). Sage Publications.
- Sherif, M. , &Sherif, C. W. (1953). Groups in harmony and tension. Harper.
- Sibley, C. G. (2024). Sampling procedure and sample details for the New Zealand attitudes and values study.
- St. Jacques, P. L. , Dolcos, F. , &Cabeza, R. (2009). Effects of aging on functional connectivity of the amygdala for subsequent memory of negative pictures: A network analysis of functional magnetic resonance imaging data. Psychological Science, 20(1), 74–84. doi.org/10.1111/j.1467-9280.2008.02258.x
- Steiger, J. H. (2007). Understanding the limitations of global fit assessment in structural equation modeling. Personality and Individual Differences, 42(5), 893–898. doi.org/10.1016/j.paid.2006.09.017
- Tyler, T. R. , &Schuller, R. A. (1991). Aging and attitude change. Journal of Personality and Social Psychology, 61(5), 689–697. doi.org/10.1037/0022-3514.61.5.689
- Vezzali, L. , Stathi, S. , Giovannini, D. , Capozza, D. , &Trifiletti, E. (2015). The greatest magic of Harry Potter: Reducing prejudice. Journal of Applied Social Psychology, 45(2), 105–121. doi.org/10.1111/jasp.12279
- Wang, J. , &Wang, X. (2012). Structural equation modeling: Applications using Mplus. Higher Education Press.
- Wilson, C. (1996). Cohort and prejudice: Whites' attitudes toward Blacks, Hispanics, Jews, and Asians. Public Opinion Quarterly, 60(2), 253–274. doi.org/10.1086/297750
- Yeoman, G. (2019). Marriage equality, five years on: we ask opposing MPs if they'd still vote no. The Spinoff.
- Zubielevitch, E. , Osborne, D. , Milojev, P. , &Sibley, C. G. (2023). Social dominance orientation and right‐wing authoritarianism across the adult lifespan: An examination of aging and cohort effects. Journal of Personality and Social Psychology, 124(3), 544–566. doi.org/10.1037/pspi0000400
Republished from the open web under CC-BY. Authors: Clarke EV, Sibley CG, Osborne D. Read the original.