SynaptoTagMe, a toolkit for in vivo mapping and modulating neurotransmission at single-cell resolution.
Understanding the organization and regulation of neurotransmission at the level of individual neurons and synapses requires tools that can track and manipulate transmitter-specific vesicles in vivo. Here, we present SynaptoTagMe, a suite of genetic tools in Caenorhabditis elegans to fluorescently label and conditionally ablate the vesicular transporters for glutamate, GABA, acetylcholine, and monoamines. Using a structure-guided approach informed by protein topology and evolutionary conservation, we engineered endogenously tagged versions for each transporter that maintain their physiological function while allowing for cell-specific, bright, and stable visualization. We also developed conditional knockout strains that enable targeted disruption of neurotransmitter synthesis or packaging in single neurons. We applied this toolkit to map co-expression of vesicular transporters across the C. elegans nervous system, revealing that over 10% of neurons exhibit co-transmission. Using the ADF sensory neuron as a case study, we demonstrate that serotonin and acetylcholine are trafficked in partially distinct vesicle pools. Our approach provides a powerful platform for mapping, monitoring, and manipulating neurotransmitter identity and use in vivo. The molecular strategies described here are likely applicable across species, offering a generalizable approach to dissect synaptic communication in vivo.
Introduction
Understanding how the nervous system generates behavior requires tools that can resolve the molecular identity, spatial localization, and functional contribution of neurotransmitters in vivo. Neurotransmitters are the primary means by which neurons communicate, and their synthesis, packaging, and release are governed by evolutionarily conserved molecular pathways shared fromCaenorhabditis elegansto vertebrates ([Südhof, 2021](#ref-Südhof, 2021)). These transmitters shape the strength, kinetics (tonic vs. phasic), and polarity (excitatory vs. inhibitory) of synaptic transmission, thereby influencing how information is processed and how behavior is regulated ([Crawford and Kavalali, 2015](#ref-Crawford and Kavalali, 2015);[Gouwens et al., 2020](#ref-Gouwens et al., 2020);[Kamalova and Nakagawa, 2021](#ref-Kamalova and Nakagawa, 2021);[Liu et al., 2021](#ref-Liu et al., 2021)). Because neurotransmitters are central to defining the functional properties of synapses, understanding their identity and dynamics is essential for interpreting circuit function. Even in organisms with complete connectomes—such asC. elegans([White et al., 1986](#ref-White et al., 1986)) andDrosophila melanogaster([Scheffer et al., 2020](#ref-Scheffer et al., 2020);[Seggewisse and Winding, 2024](#ref-Seggewisse and Winding, 2024);[Yi et al., 2024](#ref-Yi et al., 2024)), anatomical connectivity alone cannot explain how neural circuits generate behaviors. To build accurate, testable models of circuit function, it is necessary to also determine which neurotransmitters are used at specific synapses and how their release is spatiotemporally organized and regulated in vivo. Yet, despite the centrality of neurotransmitters to circuit logic, the field still lacks broadly applicable tools to visualize and manipulate transmitter-specific vesicle pools with the precision needed to study their roles in intact, living animals.
Traditional approaches—such as in situ hybridization, immunohistochemistry, and transcriptomics—have been instrumental in mapping neurotransmitter identity. These methods, however, often lack cell-specific control, temporal resolution, or the ability to monitor transmitter usage dynamically within intact circuits. Moreover, neurotransmitter identity can change in response to environmental or physiological cues. For example, neurons may co-release multiple transmitters or modulate transmitter usage depending on stress, activity, or developmental stage, and these changes have consequences in animal behavior and circuit function ([Chen et al., 2023](#ref-Chen et al., 2023);[Li et al., 2024](#ref-Li et al., 2024);[Maddaloni et al., 2024](#ref-Maddaloni et al., 2024);[Sitko et al., 2025](#ref-Sitko et al., 2025);[Wu et al., 2020](#ref-Wu et al., 2020)). Tracking and manipulating these physiological changes require new tools that allow endogenous, live imaging and functional interrogation of neurotransmitters in single neurons.
Vesicular transporters offer a strategic entry point for such investigations. These multi-pass membrane proteins package specific neurotransmitters—such as glutamate, GABA, acetylcholine, and monoamines—into synaptic vesicles and are necessary and sometimes sufficient for defining a neuron’s transmitter phenotype ([Edwards, 2007](#ref-Edwards, 2007)). Because they are genetically encoded and highly conserved ([Alfonso et al., 1993](#ref-Alfonso et al., 1993);[Bellocchio et al., 1998](#ref-Bellocchio et al., 1998);[Chaudhry et al., 1998](#ref-Chaudhry et al., 1998);[Lee et al., 1999](#ref-Lee et al., 1999);[McIntire et al., 1993](#ref-McIntire et al., 1993);[McIntire et al., 1997](#ref-McIntire et al., 1997);[Roghani et al., 1994](#ref-Roghani et al., 1994)), vesicular transporters provide a powerful molecular handle for developing generalizable tools that probe synaptic identity and function across species. Tagging these transporters can offer direct, real-time readouts of presynaptic signaling and enable manipulations that dissect the functional contribution of specific neurotransmitters in vivo ([Li et al., 2020](#ref-Li et al., 2020)). Yet for these tools to be broadly useful, it is essential that tagging does not disrupt the localization or function of the transporter. If appropriate insertion sites can be identified and validated functionally, the evolutionary conservation of vesicular transporters suggests that such designs could serve as generalizable platforms across systems and species.
Here, we present SynaptoTagMe, a comprehensive toolkit for tracking and manipulating transmitter-specific vesicles inC. elegans. Using a structure-guided approach informed by predicted protein topology and sequence conservation, we engineered endogenously tagged versions of the vesicular transporters for glutamate (EAT-4/VGLUT), GABA (UNC-47/VGAT), acetylcholine (UNC-17/VAChT), and monoamines (CAT-1/VMAT). We validated in vivo that the tagged transporters retain functionality and enable bright, cell-specific imaging. In parallel, we developed conditional knockout strains that enabled spatiotemporal access to the ablation of the packaging or synthesis of specific neurotransmitters in defined neurons, allowing causal tests of neurotransmitter function at the single-cell level within behaving animals.
We applied this toolkit to identify neurons that co-express multiple vesicular transporters, revealing that 10% ofC. elegansneurons contain the machinery for co-transmission. Focusing then on the ADF sensory neuron, we validate that ADF expresses the machinery for co-transmission of serotonin and acetylcholine. We demonstrate that serotonin and acetylcholine are packaged in partially distinct vesicle populations. Together, our observations suggest that co-transmission can be spatially organized, offering a refined view of how individual neurons diversify their signaling output in vivo. Our discoveries also highlight co-transmission as a widespread and previously underappreciated feature of nervous system organization, rather than a rare or specialized exception. Co-transmission is not unique toC. elegans; inDrosophila, the VAChT protein can be modulated in GABAergic and glutamatergic neurons by microRNAs ([Chen et al., 2023](#ref-Chen et al., 2023)); in mammals, serotonergic neurons in the dorsal raphe co-release glutamate or GABA depending on context ([Li et al., 2024](#ref-Li et al., 2024)), while starburst amacrine cells in the retina release both acetylcholine and GABA with distinct calcium sensitivities ([Lee et al., 2010](#ref-Lee et al., 2010);[Morrie and Feller, 2015](#ref-Morrie and Feller, 2015)). These examples, along with our findings, underscore the evolutionary conservation of co-transmission as a mechanism for expanding the functional repertoire of single neurons.
By enabling simultaneous visualization of different transmitter-specific vesicle pools within the same neuron, our tools uncover molecular heterogeneity at individual synapses and reveal new layers of synaptic plasticity. More broadly, our findings establish a functional framework for probing neurotransmitter dynamics, synaptic architecture, and co-transmission in vivo. The strategies developed here are generalizable to other model systems and open new avenues for dissecting neural circuit logic with molecular and cellular precision.
Results
A systematic strategy for tagging and manipulating transmitter-specific vesicles in vivo
All synaptic vesicle transporters are multi-pass transmembrane proteins with structural loops facing either the cytosolic or luminal space. To visualize transmitter-specific vesicle pools in vivo, we developed a suite of fluorescently tagged, functional versions of the vesicular transporters for glutamate (EAT-4/VGLUT), GABA (UNC-47/VGAT), acetylcholine (UNC-17/VAChT), and monoamines (CAT-1/VMAT) inC. elegans. We chose these four neurotransmitter classes because they are used by more than 90% of the neurons inC. elegans([Wang et al., 2024](#ref-Wang et al., 2024)). We used a systematic design pipeline that integrated (1) protein topology predictions, (2) evolutionary conservation, and (3) structure-guided fluorophore placement to identify regions of each transporter suitable for tagging without disrupting function. These approaches were used to generate endogenous knock-in alleles with bright, cell-specific labeling through Flippase recombinase systems ([Schwartz and Jorgensen, 2016](#ref-Schwartz and Jorgensen, 2016)) or self-assembling split-GFP tags ([He et al., 2019](#ref-He et al., 2019);Figure 1). When possible, tools were developed for both green and red-based fluorophores to allow for multi-color imaging. For each transporter, we also created matched conditional knockout strains by inserting FRT-flanked cassettes to disrupt neurotransmitter packaging or synthesis in defined cells, adding to the existing cell-specific knockout tools available in the field ([Huang et al., 2023](#ref-Huang et al., 2023);[López-Cruz et al., 2019](#ref-López-Cruz et al., 2019);Figure 1). To drive expression of Flippase in GABAergic and Cholinergic neurons, we inserted Flippase into theunc-47andunc-17locus after a self-cleaving 2A peptide sequence ([Ahier and Jarriault, 2014](#ref-Ahier and Jarriault, 2014)), and used available Flippase drivers for Serotonergic and Dopaminergic neurons ([Muñoz-Jiménez et al., 2017](#ref-Muñoz-Jiménez et al., 2017)). Together, these new tools allow precise labeling andloss-of-functionanalysis of transmitter-specific vesicles in intact circuits and behaving animals (summarized inTable 1). All strains created in this study are accessible upon request from theCaenorhabditisGenetics Center (CGC), and the respective sequences are availablehere.
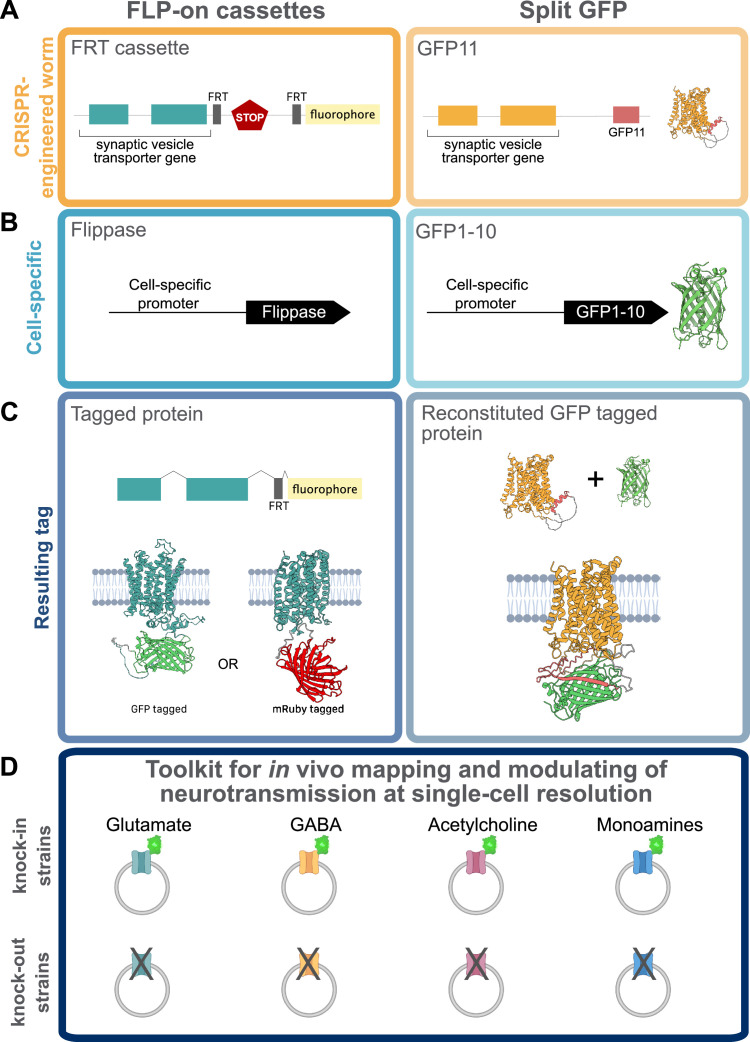
Endogenous fluorescence labeling of synaptic vesicle transporters.(Left) FLP-on and (right) split GFP strategies to endogenously label synaptic vesicle transporters. (A) Cartoon representation of the CRISPR-engineered worm in the endogenous locus of the target synaptic vesicle gene. (B) Cell-specific driver that expresses (left) Flippase or (right) GFP1-10. (C) Resulting tagged synaptic vesicle proteins with a (left) full-length GFP or mRuby3 or (right) by reconstituting GFP in the cell of interest. (D) Schematic of the resulting toolkit to label and eliminate the endogenous machinery that packages or synthesizes glutamate, GABA, acetylcholine, and monoamines. Panel D was created withBioRender.com.
Table: Cellular, genetic, and molecular tools to probe neurotransmission in single cells.
Functional labeling of glutamatergic vesicles via EAT-4/VGLUT
Glutamate functions as a key excitatory neurotransmitter in the nervous system, and its packaging into synaptic vesicles requires the conserved Vesicular Glutamate Transporter (VGLUT) ([Bellocchio et al., 1998](#ref-Bellocchio et al., 1998);[Lee et al., 1999](#ref-Lee et al., 1999)), which is sufficient to confer glutamatergic identity to a neuron. InC. elegans, the VGLUT homolog EAT-4 is expressed in 43 of the 118 neuronal classes cataloged ([Wang et al., 2024](#ref-Wang et al., 2024)). EAT-4/VGLUT is predicted to have 12 transmembrane domains (Figure 2A), and prior tools have allowed for cell-specific knockout of its full coding sequence ([López-Cruz et al., 2019](#ref-López-Cruz et al., 2019)). A previously reported transgene with EAT-4/VGLUT fused to GFP demonstrated localization to synapses ([Yu and Chang, 2022](#ref-Yu and Chang, 2022)); here we extend this approach to an endogenously tagged allele.
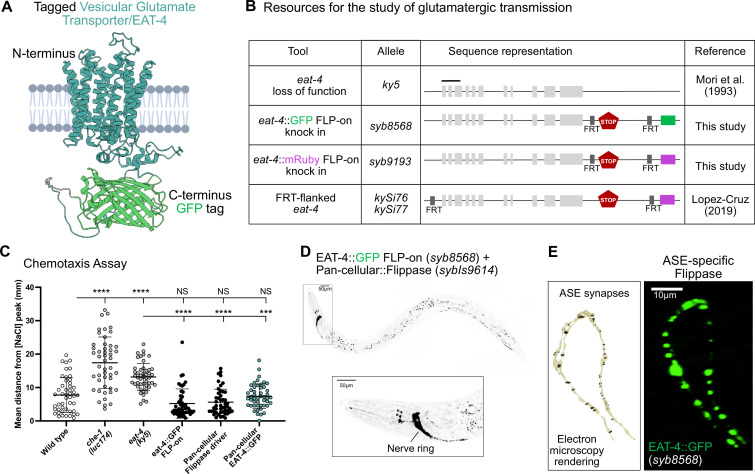
Probing glutamatergic transmission inC.elegans.(A) Predicted protein structure (using AlphaFold Protein Structure Database) of EAT-4 (cyan) tagged with GFP (green) (Abramson et al., 2024). The last amino acid in the C-terminus end (W576) corresponds to the tagged residue. (B) Schematic of the Vesicular Glutamate Transporter (VGLUT/eat-4) gene structure, loss of function allele (ky5), and endogenously tagged versions built for this study and by others.eat-4(ky5) mutants lack the first three exons. For cell-specific knock-in (KI) tools, GFP (syb8568) and mRuby (syb9193) FLP-ON cassettes (Schwartz and Jorgensen, 2016) were inserted before the STOP codon. To cell-specifically knock out (KO)eat-4, two FRT sites flank the coding sequence of theeat-4gene (kySi76 kySi77) (López-Cruz et al., 2019). When recombination takes place, theeat-4coding sequence is removed and cytosolic mCherry is inserted in-frame to be expressed as a proxy foreat-4sequence removal. (C) Mutations in theche-1(prevents ASE developmentUchida et al., 2003) (17.42 ± 7.7 mm) oreat-4gene (13.15 ± 4 mm) result in disrupted migration across the salt gradient. Wild-type animals (7.76 ± 5.2 mm) migrate across the salt gradient similarly to EAT-4::GFP FLP-on (syb8568) animals that express (7.6 ± 3.6 mm) or not (4.9 ± 4.3 mm) flippase pan-cellularly (sybIs9614). Animals that express flippase in all cells (5.61 ± 3.9 mm) migrate across the salt gradient as wild-type animals. Results represent the mean distance of each worm from the salt peak, averaged across the final minute of the assay, with each dot representing a single animal. Plots are overlaid with mean ± standard deviation. Kruskal–Wallis test with Dunn’s multiple comparison post hoc test. **** represents p < 0.0001; *** represents p < 0.001 and NS means ‘not significant’. (D) (Top) Fluorescent image of an adult worm expressing endogenously labeled EAT-4 with GFP in all cells (Peft-3::Flippase). Scale bar = 50 μm. (Bottom) Zoom-in area of the head shows EAT-4 expressed predominantly in the nerve ring. Scale bar = 10 μm. (E) (Left) Electron microscopy rendering of ASE synapses in an L4 wild-type animal (White et al., 1986) (image generated with NeuroSC;Koonce et al., 2024). (Right) Fluorescent image of endogenously tagged EAT-4 protein cell-specifically in the ASE axons (Pflp-6::Flippase). Scale bar = 10 μm.Figure 2—source data 1.Chemotaxis assay data graphed in panel C.
To generate a bright, functional reporter that reflects endogenous EAT-4/VGLUT localization in vivo, we inserted a GFP tag into the protein C-terminal cytoplasmic domain using a FLP-on cassette (Table 2) ([Schwartz and Jorgensen, 2016](#ref-Schwartz and Jorgensen, 2016)). The C-terminus was chosen based on conservation analysis and AlphaFold structural predictions ([Jumper et al., 2021](#ref-Jumper et al., 2021);[Pei and Grishin, 2001](#ref-Pei and Grishin, 2001)), which identified it as a cytosolic and weakly conserved region, minimizing the risk of disrupting conserved protein functions (Figure 2—figure supplement 1A, B). GFP was inserted just before the STOP codon (Figure 2B). To examine if the introduction of GFP into the endogenous EAT-4/VGLUT gene affected function, we assessed NaCl chemotaxis (Figure 2—figure supplement 1C)—an EAT-4-dependent learning behavior mediated by the ASE neurons (Figure 2—figure supplement 1C, D;[Bargmann and Horvitz, 1991](#ref-Bargmann and Horvitz, 1991);[Sato et al., 2021](#ref-Sato et al., 2021);[Uchida et al., 2003](#ref-Uchida et al., 2003)). EAT-4::GFP FLP-on strains, with or without Flippase expression in all neurons or selectively in ASE neurons, displayed normal chemotaxis behavior (Figure 2C,Figure 2—figure supplement 1D), in contrast toeat-4(ky5)loss-of-function mutants or mutant animals with defects in chemosensory neurons, including ASE (che-1mutants;Figure 2C,Figure 2—figure supplement 1C, D). Our findings suggest that the tagged protein remains functional and capable of sustaining known glutamate-dependent behaviors in the organism.
Table: List of all molecular locations tested for labeling each synaptic vesicle transporter.
The insertion of the FLP-on cassette enables expression of EAT-4/VGLUT::GFP upon cell-specific expression on the FLP recombinase. To validate its use, we expressed pan-cellular Flippase via theeft-3promoter ([Seydoux and Fire, 1994](#ref-Seydoux and Fire, 1994)) in the worms engineered with the EAT-4::GFP FLP-on cassette. We observed bright EAT-4::GFP signal throughout the nervous system, especially in the nerve ring and sensory neurons (Figure 2D), consistent with earlier transcriptional reporters of theeat-4gene ([Lee et al., 1999](#ref-Lee et al., 1999);[Serrano-Saiz et al., 2013](#ref-Serrano-Saiz et al., 2013)). Moreover, when Flippase was driven specifically in ASE neurons (using the ASE-specific promoter, Pflp-6), we observed punctate labeling along ASE axons, matching the distribution of presynaptic sites identified by serial electron microscopy (Figure 2E), and cataloged in NeuroSC (https://neurosc.net/) ([Koonce et al., 2024](#ref-Koonce et al., 2024);[White et al., 1986](#ref-White et al., 1986)). Consistent with this, we observed that endogenous GFP::RAB-3 in ASE similarly localizes in a punctate pattern along the axons in a pattern that is reminiscent of that seen for endogenous EAT-4::GFP (Figure 2E,Figure 2—figure supplement 2).
To expand the utility of this tool for multicolor imaging, we also generated a red-shifted FLP-on reporter for theeat-4/VGLUTgene by inserting mRuby3 ([Bajar et al., 2016](#ref-Bajar et al., 2016)) with aC. elegans-optimized sequence at the same C-terminal site (Figure 1B). These spectrally distinct reporters, when combined with the previously developedeat-4conditional knockout ([López-Cruz et al., 2019](#ref-López-Cruz et al., 2019)), provide a comprehensive toolkit for dissecting glutamatergic transmission in a cell-specific manner in vivo.
Cell-specific imaging and silencing of GABAergic neurotransmission
GABAergic neurons package GABA into synaptic vesicles via the conserved vesicular GABA transporter VGAT ([Chaudhry et al., 1998](#ref-Chaudhry et al., 1998);[McIntire et al., 1997](#ref-McIntire et al., 1997);[Mclntire et al., 1993](#ref-Mclntire et al., 1993)). InC. elegans, the VGAT homolog UNC-47 is expressed in 11 of the 118 neuronal classes ([Gendrel et al., 2016](#ref-Gendrel et al., 2016);[Wang et al., 2024](#ref-Wang et al., 2024)). Based on in vivo data, the N-terminus of VGAT is cytoplasmic while the C-terminus is luminal ([Martens et al., 2008](#ref-Martens et al., 2008)). The N-terminus contains dileucine motifs critical for proper trafficking ([Santos et al., 2013](#ref-Santos et al., 2013)), and to preserve transporter function we focused on tagging long cytoplasmic loops. Structural predictions from AlphaFold indicate that UNC-47 has 11 transmembrane domains (Figure 3A), and we identified the cytosolic loop between transmembrane domains 2 and 3—a long (13 amino acids) region (Figure 3—figure supplement 1A, B)—as an optimal tagging site (Table 2).
![Probing GABAergic transmission inC.elegans.(A) UNC-47 predicted protein structure from AlphaFold Protein Structure Database. GFP11 tag (red) was added between amino acids E145 and N146. Complementary GFP1-10 (green) was modeled as bound to GFP11. (B) Schematics of the Vesicular GABA Transporter (VGAT/unc-47) loss of function allele and endogenously tagged versions built for this study.unc-47(e307)mutant animals have a single base pair substitution (G to A in the first nucleotide of exon 6) that results in a splicing acceptor mutant. Fluorescent tags GFP (syb6990) and mKate2 (syb7358) were inserted between amino acids E145 and N146. For cell-specific endogenous labeling, UNC-47 was tagged with one (syb7313) or three copies (syb7849) of GFP11. To silence GABA transmission, we flanked the Glutamic Acid Decarboxylase/unc-25coding sequence with two FRT sites (syb5949, syb6275). Upon recombination, theunc-25coding sequence is removed and nuclear (black) mCherry (purple) is designed to be in-frame and expressed as a proxy forunc-25sequence removal. (C) (Top) Fluorescent image of an adult worm expressing endogenously labeled UNC-47 with reconstituted split-GFP in all cells (Peft-3::GFP1-10). Scale bar = 50 μm. (Bottom) Zoom-in area of the head shows UNC-47 expressed in the nerve ring and nerve cords. Scale bar = 10 μm. (D) (Left) Electron microscopy renderings of RIB synapses in an L4 wild-type animal (White et al., 1986) (image generated with NeuroSC[https://neurosc.net/];Koonce et al., 2024). (Right) RIB-specific UNC-47 puncta (green) in vivo using the UNC-47:GFP11 with reconstituted split-GFP in RIB (Psto-3b::GFP1-10). Scale bar = 10 μm. (E)unc-47(e307) mutant animals thrash significantly less per minute (30.8 ± 17) than wild-type animals (94.5 ± 10). Animals with non-reconstituted UNC-47::GFP11X3 (82.2 ± 9) (syb7849) thrash slightly less than wild-type animals (94.5 ± 10), while animals that express pan-cellular GFP1-10 (100.5 ± 9) (muIs253) are no different than wild-type animals. UNC-47::GFP11x3 animals that express Pan-cellular::GFP1-10 (with reconstituted GFP) (88.6 ± 7) thrash similarly to wild-type animals. FRT-flankedunc-25animals (syb5949,syb6275) that do not express Flippase (95.8 ± 12) thrash similarly to wild-type animals (91 ± 8). Cell-specificunc-25knockout animals (syb5949,syb6275) that express Flippase in every neuron (bqSi506) (49.36 ± 19) thrash to the same extent asunc-25(e156) mutant animals (40.2 ± 19). Plots are overlaid with mean ± standard deviation. Kruskal–Wallis test with Dunn’s multiple comparison post hoc test. **** represents p < 0.0001; *** represents p < 0.001; and NS means ‘not significant’.Figure 3—source data 1.Chemotaxis assay data graphed in panel E.](https://pub-4f2af807d45642319f8e7f07a4c88770.r2.dev/PMC13299628/elife-108675-fig3.jpg)
Probing GABAergic transmission inC.elegans.(A) UNC-47 predicted protein structure from AlphaFold Protein Structure Database. GFP11 tag (red) was added between amino acids E145 and N146. Complementary GFP1-10 (green) was modeled as bound to GFP11. (B) Schematics of the Vesicular GABA Transporter (VGAT/unc-47) loss of function allele and endogenously tagged versions built for this study.unc-47(e307)mutant animals have a single base pair substitution (G to A in the first nucleotide of exon 6) that results in a splicing acceptor mutant. Fluorescent tags GFP (syb6990) and mKate2 (syb7358) were inserted between amino acids E145 and N146. For cell-specific endogenous labeling, UNC-47 was tagged with one (syb7313) or three copies (syb7849) of GFP11. To silence GABA transmission, we flanked the Glutamic Acid Decarboxylase/unc-25coding sequence with two FRT sites (syb5949, syb6275). Upon recombination, theunc-25coding sequence is removed and nuclear (black) mCherry (purple) is designed to be in-frame and expressed as a proxy forunc-25sequence removal. (C) (Top) Fluorescent image of an adult worm expressing endogenously labeled UNC-47 with reconstituted split-GFP in all cells (Peft-3::GFP1-10). Scale bar = 50 μm. (Bottom) Zoom-in area of the head shows UNC-47 expressed in the nerve ring and nerve cords. Scale bar = 10 μm. (D) (Left) Electron microscopy renderings of RIB synapses in an L4 wild-type animal (White et al., 1986) (image generated with NeuroSC[https://neurosc.net/];Koonce et al., 2024). (Right) RIB-specific UNC-47 puncta (green) in vivo using the UNC-47:GFP11 with reconstituted split-GFP in RIB (Psto-3b::GFP1-10). Scale bar = 10 μm. (E)unc-47(e307) mutant animals thrash significantly less per minute (30.8 ± 17) than wild-type animals (94.5 ± 10). Animals with non-reconstituted UNC-47::GFP11X3 (82.2 ± 9) (syb7849) thrash slightly less than wild-type animals (94.5 ± 10), while animals that express pan-cellular GFP1-10 (100.5 ± 9) (muIs253) are no different than wild-type animals. UNC-47::GFP11x3 animals that express Pan-cellular::GFP1-10 (with reconstituted GFP) (88.6 ± 7) thrash similarly to wild-type animals. FRT-flankedunc-25animals (syb5949,syb6275) that do not express Flippase (95.8 ± 12) thrash similarly to wild-type animals (91 ± 8). Cell-specificunc-25knockout animals (syb5949,syb6275) that express Flippase in every neuron (bqSi506) (49.36 ± 19) thrash to the same extent asunc-25(e156) mutant animals (40.2 ± 19). Plots are overlaid with mean ± standard deviation. Kruskal–Wallis test with Dunn’s multiple comparison post hoc test. **** represents p < 0.0001; *** represents p < 0.001; and NS means ‘not significant’.Figure 3—source data 1.Chemotaxis assay data graphed in panel E.
Within this loop, AlphaFold predicts two beta-sheet regions with high confidence. We inserted GFP between amino acids E145 and N146, immediately following the first predicted beta sheet, to avoid disrupting secondary structures (Figure 3,Figure 3—figure supplement 1). To assess functionality of the newly engineered UNC-47/VGAT::GFP strain, we performed thrashing assays onunc-47 (e307)mutants, which show impaired locomotion due to loss of GABA signaling at neuromuscular junctions ([McIntire et al., 1993](#ref-McIntire et al., 1993)). Expression of UNC-47::GFP from an extrachromosomal array rescued the thrashing defect to wild-type levels (Figure 3—figure supplement 1C, D), as expected. We next generated endogenous knock-ins of GFP and mKate2 at the same site but in the endogenousunc-47locus, and observed wild-type locomotion for these strains, consistent with the insertion of the fluorophores not affecting endogenous function of the transporter (Figure 3—figure supplement 1D). These strains showed bright, punctate fluorescence in the nerve ring and along the dorsal and ventral nerve cords (Figure 3—figure supplement 1E, F), consistent with previously reportedunc-47expression patterns ([McIntire et al., 1997](#ref-McIntire et al., 1997)). Together, these results demonstrate that inserting a fluorescent protein at position E145 results in a functionally tagged UNC-47/VGAT reporter that enables endogenous visualization of the protein.
To enable in vivo visualization of GABAergic vesicles in single cells, we next generated two UNC-47::splitGFP alleles by inserting either one or three tandem copies of GFP11 at the E145 position (Figure 3B). We used the splitGFP approach to avoid disruptions of the protein structures due to the introduction of the FRT-cassettes at an internal sequence site. By leveraging the self-assembling property of the GFP beta barrel, knock-in of the eleventh beta strand (GFP11) results in labeling of a protein that is only visible when the complementary GFP1-10 is expressed in the same cell. This property results in a combinatorial labeling strategy, in which cell-specific labeling is achieved only in those cells that express both the GFP11 and the GFP 1–10 ([He et al., 2019](#ref-He et al., 2019)). To validate these tools, we first achieved pan-cellular expression of GFP1-10 (eft-3promoter) ([Seydoux and Fire, 1994](#ref-Seydoux and Fire, 1994)) in animals carrying the UNC-47::GFP11x3 (syb7849) allele. We observed GABAergic synapses throughout the nerve ring and nerve cords (Figure 3C), similar to full-body knock-in strains (Figure 3—figure supplement 1E, F). To then visualize GABAergic vesicles in subsets of cells, we expressed GFP1-10 in the GABAergic DD motor neurons using theflp-13promoter and in animals carrying the GFP11 (syb7313) or UNC-47::GFP11x3 (syb7849) alleles. We observed punctate reconstituted signal in the dorsal nerve cord of both GFP11 and GFP11x3 strains, consistent with the known distribution of DD synapses (Figure 3—figure supplement 2E). The triple GFP11 version produced significantly brighter signal (Figure 3—figure supplement 2E–G), in line with reports of enhanced fluorescence from multimerized tags ([He et al., 2019](#ref-He et al., 2019)).
To then visualize GABAergic synapses in single cells, we expressed GFP1-10 under an RIB-interneuron, cell-specific promoter. We selected RIB because it is a GABAergic interneuron embedded in the nerve ring and proximal to three other GABAergic interneurons with overlapping neurites that impede visualization of RIB-specific synapses in vivo when using traditional approaches (Figure 3—figure supplement 2A–C). Reconstituted fluorescence using our tools enabled visualization of RIB-specific synapses, and the observed synaptic pattern was consistent with the pattern expected from electron microscopy reconstructions (Figure 3D;[Koonce et al., 2024](#ref-Koonce et al., 2024);[White et al., 1986](#ref-White et al., 1986)) (https://neurosc.net/) and from expression of endogenous mScarlet::RAB-3 in RIB neurons (Figure 3—figure supplement 2D). These findings underscore the value of the tool in labeling GABAergic synapses in individual cells in vivo.
To functionally dissect GABAergic transmission, we developed a conditional knockout ofunc-25, the gene encoding Glutamic Acid Decarboxylase (GAD), which catalyzes GABA synthesis. We decided to targetunc-25/GAD because it results in the elimination of GABA from neurons ([Gendrel et al., 2016](#ref-Gendrel et al., 2016)). We flanked theunc-25coding sequence with FRT sites and inserted a nuclear mCherry reporter downstream to indicate successful recombination (Figure 3B). We then validated the tool by using thrashing assays. Consistent with previous findings,unc-25null mutants show severely reduced locomotion in the thrashing assays ([McIntire et al., 1993](#ref-McIntire et al., 1993);Figure 3E). We observed that animals carrying the conditional knockout allele behaved normally in the absence of Flippase, but that pan-cellular Flippase expression in all GABAergic neurons (unc-47promoter), which is expected to result in loss of GABAergic neurotransmission, phenocopied the thrashing defect ofunc-25mutants (Figure 3E). These results confirm that this tool effectively eliminatesunc-25/GAD activity, with the capacity to be activated in a cell-specific manner and allows investigation of how GABAergic transmission contributes to neural function and behavior.
Functional labeling of cholinergic vesicles via UNC-17/VAChT
The cholinergic identity of neurons is defined by the expression of a conserved gene locus, shared from nematodes to vertebrates, that includes both the acetylcholine synthesis enzyme Choline Acetyltransferase (ChAT) and the Vesicular Acetylcholine Transporter (VAChT) ([Eiden, 1998](#ref-Eiden, 1998)). InC. elegans, the VAChT homolog UNC-17 is expressed in 57 of the 118 neuronal classes ([Wang et al., 2024](#ref-Wang et al., 2024)). Based on prior studies, both the N- and C-termini of VAChT face the cytosol and contain regulatory motifs important for trafficking ([Fei et al., 2008](#ref-Fei et al., 2008)). AlphaFold predicts UNC-17 has 12 transmembrane domains, but most cytosolic loops are very short (<5 amino acids), except for the third cytoplasmic loop, which contains 28 amino acids and exhibits relatively high sequence conservation (Figure 4—figure supplement 1A, B).
To determine suitable tagging sites for imaging UNC-17 without disrupting function, we tested three locations (Table 2): the conserved third cytosolic loop (site 1), the N-terminus (site 2), and the C-terminus (site 3) (Figure 4—figure supplement 1B, C, E). We used a thrashing assay to assess function, asunc-17(e245) null mutants fail to thrash in liquid and are rescued by the re-expression of untagged UNC-17 under its own promoter (Figure 4—figure supplement 1F). We generated transgenic strains with a rescue array containing theunc-17gene with GFP inserted into these three sites. We observed that GFP insertion into site 1 failed to rescue the phenotype, suggesting disruption of UNC-17 function. In contrast, tagging either the N-terminus or C-terminus restored normal thrashing (Figure 4—figure supplement 1E, F), indicating that these positions tolerate modification. Informed by these rescue experiments, we then generated two FLP-on conditional knockout alleles ([Schwartz and Jorgensen, 2016](#ref-Schwartz and Jorgensen, 2016)) with GFP inserted at either the N-terminus (syb7251) or C-terminus (ola503) (Figure 4A, B). To test whether the FLP-on cassettes affected protein function, we examined behavior before Flippase expression and found that both alleles behaved like wild-type animals (Figure 4—figure supplement 1F). Because splicing regulatory elements are located near the 5′ end of theunc-17gene and are required for successful splicing of the cholinergic locus (bothunc-17andcha-1transcripts) ([Mathews et al., 2015](#ref-Mathews et al., 2015)), we proceeded with the C-terminally taggedola503allele, which leaves the 5′ region intact. We tested whether pan-cellular expression of Flippase in this strain impairs behavior. Animals with global GFP-tagged UNC-17 showed wild-type thrashing in liquid (Figure 4C), confirming that the tagged transporter is functional and validating this approach for cell-specific labeling of cholinergic vesicle pools.
![Probing cholinergic transmission inC.elegans.(A) Predicted UNC-17 protein structure (magenta) tagged with GFP (green) on the last amino acid in the C-terminus end (W532). (B) Schematics of the Vesicular Acetylcholine Transporter (VACHT/unc-17) loss-of-function allele and endogenously tagged versions tested in this study (and built by others).unc-17(e245)mutant animals have a single base pair substitution in the third exon which leads to an amino acid change (arrowhead). Full-body knock-in animal labels UNC-17 with mKate (ot907). For cell-specific labeling, the N-terminus GFP FLP-ON cassette (syb7251) was inserted between amino acids P6 and V7 (see Methods). Similarly, the C-terminus GFP FLP-ON cassette (ola503) and mRuby FLP-on cassette (syb7882) were inserted before the STOP codon. (C)unc-17(e245)mutant animals (1.9 ± 2) thrash significantly less than wild-type animals (93 ± 10). UNC-17::GFP FLP-on (ola503) animals that express pan-cellular::Flippase (88 ± 1) (sybIs9614) or animals that only express pan-cellular::Flippase (94.8 ± 12) are indistinguishable from wild-type animals in their thrashing behavior. UNC-17::GFP FLP-on animals (98.7 ± 8) thrash significantly more than wild-type animals. Mean ± standard deviation. Brown–Forsythe ANOVA test with Dunnett’s T3 multiple comparisons post hoc test. **** represents p < 0.0001; * represents p < 0.05; and NS means ‘not significant’. (D) (Top) Fluorescent image of an adult worm expressing endogenously labeled UNC-17::GFP in all cells (Peft-3::Flippase). Scale bar = 50 μm. (Bottom) Zoom-in area of the head shows UNC-17 expressed in the nerve ring, nerve cords and sub-lateral cords. DNC = dorsal nerve cord, VNC = ventral nerve cord. Scale bar = 10 μm. (E) (Left) Electron microscopy rendering of ADF synapses in an L4 wild-type animal (White et al., 1986) (image generated with NeuroSC [https://neurosc.net/];Koonce et al., 2024). (Right) Fluorescence image of endogenously tagged UNC-17::GFP protein specifically in the ADF neuron. Scale bar = 10 μm.Figure 4—source data 1.Thrashing assay data graphed in panel C.](https://pub-4f2af807d45642319f8e7f07a4c88770.r2.dev/PMC13299628/elife-108675-fig4.jpg)
Probing cholinergic transmission inC.elegans.(A) Predicted UNC-17 protein structure (magenta) tagged with GFP (green) on the last amino acid in the C-terminus end (W532). (B) Schematics of the Vesicular Acetylcholine Transporter (VACHT/unc-17) loss-of-function allele and endogenously tagged versions tested in this study (and built by others).unc-17(e245)mutant animals have a single base pair substitution in the third exon which leads to an amino acid change (arrowhead). Full-body knock-in animal labels UNC-17 with mKate (ot907). For cell-specific labeling, the N-terminus GFP FLP-ON cassette (syb7251) was inserted between amino acids P6 and V7 (see Methods). Similarly, the C-terminus GFP FLP-ON cassette (ola503) and mRuby FLP-on cassette (syb7882) were inserted before the STOP codon. (C)unc-17(e245)mutant animals (1.9 ± 2) thrash significantly less than wild-type animals (93 ± 10). UNC-17::GFP FLP-on (ola503) animals that express pan-cellular::Flippase (88 ± 1) (sybIs9614) or animals that only express pan-cellular::Flippase (94.8 ± 12) are indistinguishable from wild-type animals in their thrashing behavior. UNC-17::GFP FLP-on animals (98.7 ± 8) thrash significantly more than wild-type animals. Mean ± standard deviation. Brown–Forsythe ANOVA test with Dunnett’s T3 multiple comparisons post hoc test. **** represents p < 0.0001; * represents p < 0.05; and NS means ‘not significant’. (D) (Top) Fluorescent image of an adult worm expressing endogenously labeled UNC-17::GFP in all cells (Peft-3::Flippase). Scale bar = 50 μm. (Bottom) Zoom-in area of the head shows UNC-17 expressed in the nerve ring, nerve cords and sub-lateral cords. DNC = dorsal nerve cord, VNC = ventral nerve cord. Scale bar = 10 μm. (E) (Left) Electron microscopy rendering of ADF synapses in an L4 wild-type animal (White et al., 1986) (image generated with NeuroSC [https://neurosc.net/];Koonce et al., 2024). (Right) Fluorescence image of endogenously tagged UNC-17::GFP protein specifically in the ADF neuron. Scale bar = 10 μm.Figure 4—source data 1.Thrashing assay data graphed in panel C.
At the cellular level, GFP labeling of UNC-17/VAChT using theola503allele and pan-cellular Flippase expression (driven by theeft-3promoter) ([Seydoux and Fire, 1994](#ref-Seydoux and Fire, 1994)) resulted in fluorescence in the nerve ring, dorsal cord, ventral cord, and sublateral cords (Figure 4D). This expression pattern matched that of a full-body mKate2 knock-in of endogenous UNC-17/VAChT (Figure 4—figure supplement 1D;[Pereira et al., 2019](#ref-Pereira et al., 2019)) and was consistent with prior transcriptional reporters ([Pereira et al., 2015](#ref-Pereira et al., 2015)) and anti-UNC-17 antibody staining ([Duerr et al., 2008](#ref-Duerr et al., 2008)). Theola503allele also enables cell-specific labeling. When Flippase was expressed specifically in ADF neurons using the Psrh-142promoter ([Maicas et al., 2021](#ref-Maicas et al., 2021)), we observed UNC-17::GFP puncta along the ADF axon (Figure 4E). This punctate pattern aligned with known ADF presynaptic sites from electron microscopy reconstructions of L4 animals (https://neurosc.net/) ([Koonce et al., 2024](#ref-Koonce et al., 2024);[White et al., 1986](#ref-White et al., 1986)). Together, these results demonstrate that the UNC-17::GFP FLP-on allele provides a reliable tool to label cholinergic vesicles in individual neurons in vivo, and that this labeling does not affect function in our assays. To enable multicolor imaging, we generated a red, fluorescent version of the UNC-17/VAChT tool by replacing GFP withC. elegans-optimized mRuby3 (Figure 4B). This mRuby-tagged allele performs as wild-type animals in a thrashing assay and labels synaptic structures along the nerve ring and nerve cords (Figure 4—figure supplement 2A, B). Combined with the previously described cell-specificunc-17knockout strain ([Huang et al., 2023](#ref-Huang et al., 2023);Figure 4B), these tools allow precise tracking and manipulation of cholinergic neurotransmission in vivo.
Probing monoaminergic transmission
Monoamines such as serotonin, dopamine, norepinephrine, epinephrine, octopamine, and tyramine are transported into vesicles by the conserved Vesicular Monoamine transporter ([Duerr et al., 1999](#ref-Duerr et al., 1999);[Erickson et al., 1992](#ref-Erickson et al., 1992)). InC. elegans, the VMAT homolog CAT-1 is expressed in 16 of the 118 neuronal classes ([Wang et al., 2024](#ref-Wang et al., 2024)). Recently, CAT-1 was tagged at its C-terminus with a split GFP11x3 reporter (Figure 5A, B;[Huang et al., 2023](#ref-Huang et al., 2023)). When GFP is reconstituted pan-cellularly, this fusion produces a punctate signal enriched in the nerve ring—including the characteristic and well-known serotonergic neuron NSM—and in serotonergic neurons that are part of the reproductive organs (Figure 5C).
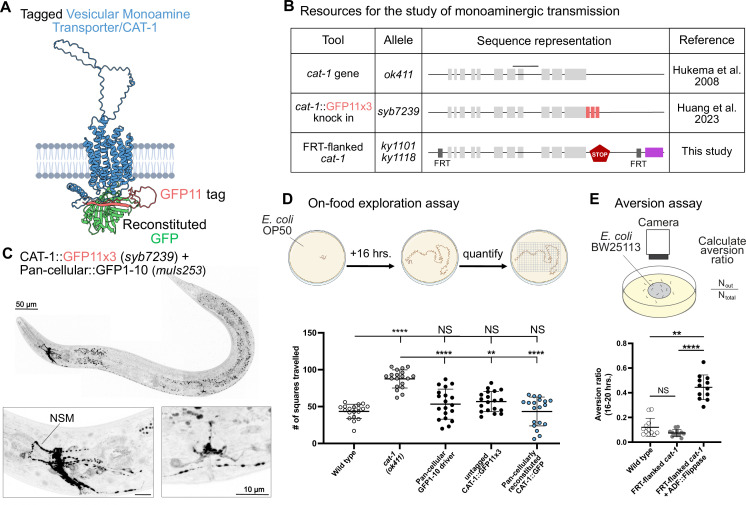
Probing Monoaminergic transmission inC.elegans.(A) Predicted CAT-1 protein structure (blue) labeled with GFP11 (red) at C-terminus end (E145). Complementary GFP1-10 (green) was modeled with bound GFP11. (B) Schematic of the Vesicular Monoamine Transporter (VMAT/cat-1) loss-of-function allele and endogenously tagged versions used to monitor monoaminergic transmission.cat-1(ok411) mutant animals have a deletion that spans exons 7 and 8 (black line) of thecat-1gene. For cell-specific labeling, three copies of GFP11 (syb7239) were inserted before the STOP codon. For cell-specific silencing ofcat-1activity, two FRT sites (ky1101 ky1118) flank the coding sequence of thecat-1gene. Upon recombination, expression of cytosolic mCherry (magenta) is used as a proxy for deletion of thecat-1coding sequence. (C) (Top) Fluorescence image of reconstituted CAT-1::GFP11x3 with expression of complementary GFP1-10 in the whole animal (Peft-3::GFP1-10). Scale bar = 50 μm. (Bottom) Zoom-in of the (Left) head and (Right) vulva area of an adult worm shows CAT-1 expressed in the nerve ring and pharyngeal neurons as well as in the vulva. Scale bar = 10 μm. (D) (Top) A well-fed day-1 adult animal is placed on NGM plates covered with a thin layer of bacteria, allowed to roam for 16 hr and the number of squares traveled was recorded. (Bottom) Wild-type animals (43.6 ± 10) roam less thancat-1(ok411) mutants (87.5±12). CAT-1::GFP11x3 (syb7239) animals with GFP reconstituted (43.3 ± 20) (or not (56.8 ± 14)) roam similar to wild-type animals. Animals with pan-cellular expression of GFP1-10 (muIs253) (53.3 ± 20) also roam like wild-type animals. (E) (Top) A well-fed day-1 adult animal is placed on NGM plates covered with a thin layer ofE. coli, allowed to roam for 20 hr and the aversion ratio was calculated. (Bottom) Wild-type animals (0.12±0.07) display less aversion toE. colilawns than ADF-specificcat-1conditional KO animals (ky1101 ky1118; syb9159) (0.4 ± 0.1), consistent with previous reports using serotonin-depletion mutants (Feng et al., 2025).cat-1conditional KO animals that do not express Flippase in ADF neurons (0.07 ± 0.03) are indistinguishable from wild-type. Mean ± standard deviation. Kruskal–Wallis test with Dunn’s multiple comparison post hoc test. **** represents p < 0.0001; ** represents p < 0.01; * represents p < 0.05; and NS means ‘not significant’.Figure 5—source data 1.On-food exploration assay data graphed in panel D.Figure 5—source data 2.Aversion assay data graphed in panel E.
To determine whether the CAT-1::GFP11x3 fusion maintains protein function, we used a behavioral assay based on the role of serotonin to prevent animal exploration on a lawn of bacteria ([Flavell et al., 2013](#ref-Flavell et al., 2013)). Since serotonin is packaged into vesicles by CAT-1/VMAT, similar to mutants of serotonin production ([Flavell et al., 2013](#ref-Flavell et al., 2013)),cat-1mutants display increased exploration behavior compared to wild-type animals (Figure 5D). We found that animals with reconstituted CAT-1::GFP11x3 explore bacterial lawns at levels comparable to wild-type (Figure 5D), indicating that the GFP11x3 tag nor its reconstitution impair CAT-1 function. To complement this tool, we also developed a cell-specificcat-1knockout allele in which the full coding sequence is excised upon Flippase expression (Figure 5B). Removal of serotonin production (tph-1) specifically from ADF neurons results in increased aversion from wild-typeE. colibacteria lawns ([Feng et al., 2025](#ref-Feng et al., 2025)). Consistent with this, cell-specific KO ofcat-1in ADF neurons (via expression of ADF::Flippase) results in increasedE. coliaversion (Figure 5E). Together, these tools now enable the cell-specific tracking and silencing of monoaminergic synapses in living animals.
In vivo identification of co-transmitter neurons
Co-transmission is a conserved feature of neurons across the animal kingdom ([Granger et al., 2017](#ref-Granger et al., 2017);[Trudeau and El Mestikawy, 2018](#ref-Trudeau and El Mestikawy, 2018);[Vaaga et al., 2014](#ref-Vaaga et al., 2014)), includingC. elegans([Duerr et al., 2008](#ref-Duerr et al., 2008);[Gendrel et al., 2016](#ref-Gendrel et al., 2016);[Pereira et al., 2015](#ref-Pereira et al., 2015);[Pocock and Hobert, 2010](#ref-Pocock and Hobert, 2010);[Serrano-Saiz et al., 2017](#ref-Serrano-Saiz et al., 2017);[Serrano-Saiz et al., 2013](#ref-Serrano-Saiz et al., 2013);[Taylor et al., 2021](#ref-Taylor et al., 2021);[Wang et al., 2024](#ref-Wang et al., 2024)), but the prevalence of co-transmission in vivo for any given organism is not well understood. To validate the utility of our tools and to map the architecture of co-transmission inC. elegans, we developed an intersectional genetic strategy using Flippase recombinase and FRT-flanked fluorescent reporters (Figure 6A). We focused on identifying neurons that co-transmit glutamate or acetylcholine—the two most abundant excitatory neurotransmitters inC. elegans—in combination with other transmitters (Figure 6B).
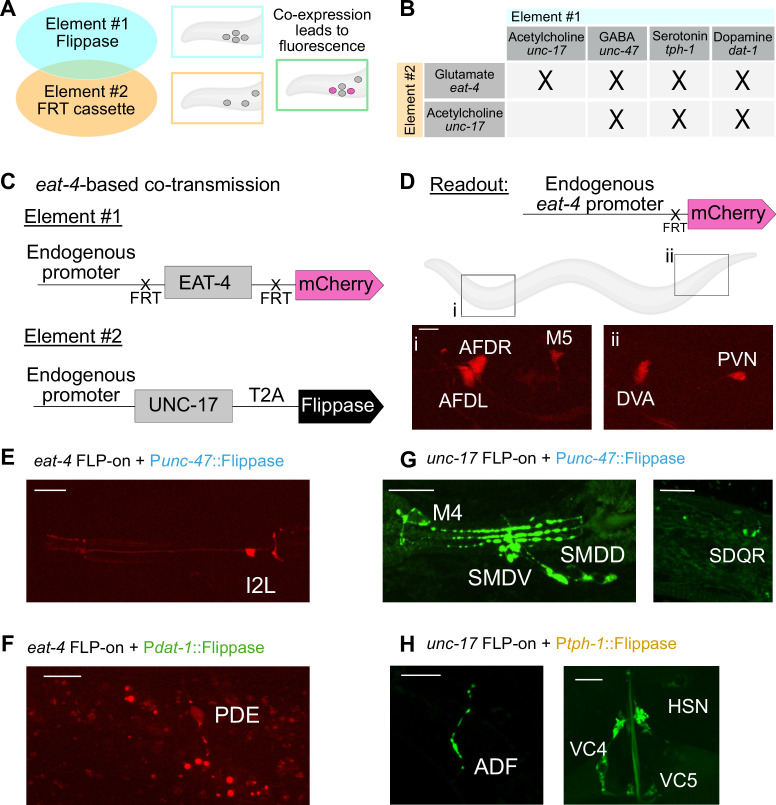
Mapping of co-transmitter neurons in theC.elegansnervous system.(A) Schematic of the approach used to find co-expression of two vesicular transporters in the same cells. Flippase drivers (Element #1, blue) and Flippase-dependent cassettes that result in fluorescence (Element #2, orange) are used. Magenta cells are seen when both elements are co-expressed (in green box). (B) Strategy to track the co-expression of the vesicular glutamate and acetylcholine transporter in combination with the 4 most common neurotransmitters inC. elegans: Acetylcholine, GABA, serotonin, and dopamine. ‘Elements #1’ or ‘Element #2’ refers to the genetic elements in the schematic in A. (C, D) Specific example of the genetic strategy outlined in A, for the vesicular transporters of glutamate (EAT-4) and acetylcholine (UNC-17). (C) We repurposed theeat-4conditional KO strain (kySi76 kySi77) (Figure 1B;López-Cruz et al., 2019) in which theeat-4gene coding sequence is flanked by two FRT sites and followed by cytosolic mCherry (Element #1). We crossed this line with a strain that has an endogenously inserted self-cleaving peptide sequence (T2A) followed by Flippase before the STOP codon in theunc-17gene locus (Table 1). (D) (Top) Co-expression of EAT-4 and UNC-17 results in cytosolic mCherry. (Bottom) Cytosolic mCherry was detected in the head of three neurons: (i) AFDR, AFDL, and M5; and in two neurons in the tail region: (ii) PVN and DVA. (E) Fluorescence microscopy shows neurons with co-expression of (E) VGLUT/EAT-4 and VGAT/UNC-47; (F) VGLUT/EAT-4 and dopamine synthesis gene DAT-1; (G) VAChT/UNC-17 and VGAT/UNC-47; and (H) VAChT/UNC-17 and the serotonin synthesis gene TPH-1. All scale bars = 10 μm.
We reasoned that if two neurotransmitters were co-expressed in the same neuron, driving Flippase under the promoter of one transmitter would activate the conditional reporter—resulting in fluorescence—only in cells also expressing a second neurotransmitter identity (Figure 6A, B). To achieve this, we used the engineered alleles for each vesicular transporter that we developed (Figures 2B–5B—5,Table 1) and developed additional Flippase driver by modifying the locus of genes involved in the packaging of acetylcholine (unc-17) and GABA (unc-47) (Table 1). Additionally, we used available Flippase driver lines for serotonin and dopamine (Figure 6—figure supplement 1A, B,Table 1;[Muñoz-Jiménez et al., 2017](#ref-Muñoz-Jiménez et al., 2017)).
We first used a conditionaleat-4/VGLUTreporter strain in which cytosolic mCherry is expressed upon Flippase-mediated recombination ([López-Cruz et al., 2019](#ref-López-Cruz et al., 2019)). When Flippase was driven by theunc-17/VAChTpromoter (cholinergic), we observed five mCherry-positive neurons in the head and tail, consistent with co-expression ofunc-17/VAChTandeat-4/VGLUT. Based on cell position, neurite morphology, transcriptomic data ([Taylor et al., 2021](#ref-Taylor et al., 2021)), and anatomical maps ([Wang et al., 2024](#ref-Wang et al., 2024)), we identified these neurons as AFDL, AFDR, M5, DVA, and PVN (Figure 6C, D).
Flippase expression from the GABAergicunc-47promoter activatedeat-4-driven mCherry expression in a single pharyngeal neuron, identified as I2L (Figure 6E,Figure 6—figure supplement 2A). Driving Flippase from the dopaminergicdat-1promoter labeled the PDE neuron (Figure 6F,Figure 6—figure supplement 2B), while serotonergictph-1-driven Flippase did not produce any mCherry-positive neurons. These results are summarized inFigure 6—figure supplement 1C.
We applied a similar strategy by using our Flippase-dependentunc-17::GFP reporter to identify candidate neurons that co-release acetylcholine with other neurotransmitters. In this context, when Flippase was driven from the GABAergicunc-47locus, we observed GFP expression in the M4, SDQR, and SMD neurons (Figure 6G,Figure 6—figure supplement 2D). Flippase expression from the serotonergictph-1promoter revealed previously described acetylcholine/serotonin co-transmitting neurons, including ADF, HSN, and VC4/VC5 (Figure 6H,Figure 6—figure supplement 2G), consistent with prior findings ([Pereira et al., 2015](#ref-Pereira et al., 2015)). All neurons identified through this dual-reporter approach are summarized inFigure 6—figure supplement 1C.
We compared our findings with previous reports and have compiled a list of potential co-transmitter neurons that are consistently identified across independent studies (Figure 6—figure supplement 3), suggesting these are likelybona fideco-transmitter neurons. Together, we observe thatC. eleganshas 35 neurons exhibiting molecular signatures of co-transmission (Table 3)—representing ~10% of theC. elegansnervous system (Figure 6—figure supplement 3andTable 4). Strikingly, the pharyngeal nervous system—analogous to the vertebrate enteric nervous system ([Albertson and Thomson, 1976](#ref-Albertson and Thomson, 1976))—had the highest density of co-transmitter neurons: 30% (6 of 20 neurons) displayed co-expression of multiple vesicular transporters. Across the entire nervous system, co-transmission was prevalent among sensory neurons, with 12% (10 of 83), compared to 11% of interneurons (9 of 81) and 7% of motor neurons (8 of 116) (Table 3). We also compiled a list of neurons that were suggested to be co-transmitters (RIB, AVA, and AVB) ([Gendrel et al., 2016](#ref-Gendrel et al., 2016)), but that are not supported by other expression studies ([Taylor et al., 2021](#ref-Taylor et al., 2021);Table 5).
Table: List of potential co-transmitter neurons by neuronal type.
Table: List of potential co-transmitter neurons reported by at least more than one study.
Table: List of neurons inconsistent across studies to suggest co-transmission capacity.
In vivo visualization of co-transmitter synapses in the ADF chemosensory neuron
We next used our toolkit to investigate the subcellular localization of vesicular transporters in a co-transmitting neuron, ADF. The ADF neurons are a bilaterally symmetric pair of sensory neurons inC. elegansknown to regulate food exploration, chemotaxis, and entry into the lethargic-like dauer state ([Bargmann and Horvitz, 1991](#ref-Bargmann and Horvitz, 1991)). While ADF has long been known to use serotonergic neurotransmission, our findings indicate that it is also capable of acetylcholine synthesis and packaging (Figure 6H,Figure 6—figure supplement 1C, andFigure 7—figure supplement 1A, B). Our findings are consistent with recent transcriptomic and reporter-based studies ([Pereira et al., 2015](#ref-Pereira et al., 2015);[Taylor et al., 2021](#ref-Taylor et al., 2021);[Wang et al., 2024](#ref-Wang et al., 2024)).
To examine the subcellular distribution of serotonin or acetylcholine vesicular transporters in ADF, we used previously developed tools to endogenously label the serotonin vesicular transporter CAT-1/VMAT ([Huang et al., 2023](#ref-Huang et al., 2023)), and the acetylcholine vesicular transporter UNC-17/VAChT with GFP (Figures 4and5). To label these vesicular transporters specifically in ADF, we drove Flippase and GFP1-10 expression using the AFD-specific promoter,srh-142promoter ([Maicas et al., 2021](#ref-Maicas et al., 2021)). Both UNC-17/VAChT and CAT-1/VMAT displayed punctate fluorescence along the ADF axon, consistent with the location of presynaptic sites expected from electron microscopy-based 3D reconstructions (Figure 7—figure supplement 1C;[Koonce et al., 2024](#ref-Koonce et al., 2024);[White et al., 1986](#ref-White et al., 1986)).
To then visualize the spatial relationship between these two vesicular transporters, we generated a strain in which UNC-17/VAChT was tagged with mRuby and CAT-1/VMAT with GFP at their respective endogenous loci, cell-specifically in ADF neurons (Figure 7A). In vivo imaging using a spinning disk confocal microscope revealed that these transporters frequently co-localize within the same synaptic boutons (Figure 7B, B’). Interestingly, we also found instances in which the UNC-17/VAChT::mRuby and CAT-1/VMAT::GFP signals partially segregate into separate boutons along the same axon (Figure 7C, C’), suggesting that these vesicular transporters can be sorted into distinct vesicle populations. Consistent with the idea that UNC-17 and CAT-1 localizes to synaptic vesicles along the axon, we observed that UNC-17 and CAT-1 localization was disrupted in a Kif1A/unc-104(e1265) mutant animal ([Hall and Hedgecock, 1991](#ref-Hall and Hedgecock, 1991)), absent in the axon and accumulated in the cell body (Figure 7D–D’).
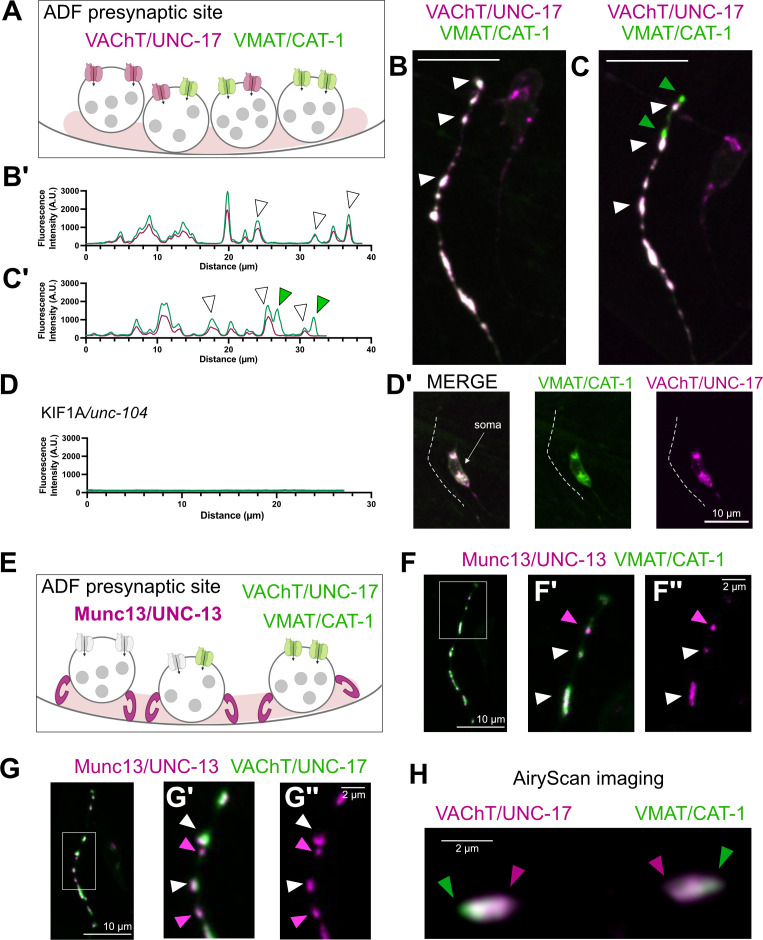
Visualizing the distribution of cholinergic and serotonergic vesicles in ADF neurons.(A) Dual-labeling of the endogenous acetylcholine (UNC-17, magenta) and serotonin (CAT-1, green) vesicular transporters in ADF neurons. (B) UNC-17::mRuby and CAT-1::GFP overlap along the ADF axon. White arrowheads denote overlap of both signals. (B’) UNC-17::mRuby and CAT-1::GFP intensity profile. (C) Example of UNC-17::mRuby and CAT-1::GFP when they partially do not overlap along the ADF axon, green arrowheads point to CAT-1-only puncta. (C’) UNC-17::mRuby and CAT-1::GFP intensity profile. Scale bar = 10 μm. (D, D’) Endogenous UNC-17::mRuby and CAT-1:::GFP are absent from the axon ofunc-104mutant animals. Line scan of axon (D) and fluorescent images (D’). (E) Schematic of the dual-labeling of endogenous CAT-1::GFP or UNC-17::GFP with endogenous active zone protein UNC-13::mScarlet along the ADF axon. (F) Live imaging of the ADF axon reveals UNC-13::mScarlet puncta that lack CAT-1::GFP. Scale bar = 10 μm. (F’, F’’) Zoom-in region of E. White arrowheads show overlapping vesicular transporter tagged (green) with the active zone protein UNC-13 (magenta) in individual puncta. Magenta arrowhead points to UNC-13::mScarlet puncta that do not overlap with CAT-1::GFP. (G) Live imaging of the ADF axon reveals UNC-13::mScarlet puncta that lack UNC-17::GFP. Scale bar = 10 μm. (G’, G’’) Zoom-in region of F. White arrowheads show overlapping vesicular transporter tagged (green) with the active zone protein UNC-13 (magenta) in individual puncta. Magenta arrowhead points to UNC-13::mScarlet puncta that do not overlap with CAT-1::GFP. Scale bar = 2 μm. (H) AiryScan imaging of dual-labeled UNC-17::mRuby and CAT-1::GFP along the ADF axon shows localization in the same synaptic bouton but with distinct enrichment areas. Green arrowhead points to CAT-1 enrichment and magenta arrowhead points to UNC-17 enrichment. Scale bar = 2 μm. Panel A was created withBioRender.com. Panel E was created withBioRender.com.
To test whether both transporters are present at all ADF synapses, we endogenously tagged the active zone protein UNC-13/Munc13 with mScarlet and examined its spatial relationship to UNC-17/VAChT::GFP and CAT-1/VMAT::GFP (Figure 7E). We observed active zone UNC-13::mScarlet puncta that lacked either CAT-1/VMAT::GFP (Figure 7F) or UNC-17/VAChT::GFP labeling (Figure 7G). These findings are consistent with the idea that, while these two vesicular transporters display co-localization in synaptic varicosities, they also independently localize to distinct subcellular compartments.
Synaptic varicosities inC. eleganscan be within the diffraction limits of light microscopy, preventing differentiation of co-localizing vesicular populations. To better understand the relative distribution of these vesicular transporters, we next visualized ADF synapses with increased resolution, using AiryScan imaging, which can achieve differentiation of fluorophores up to 120 nm apart ([Wu and Hammer, 2021](#ref-Wu and Hammer, 2021)). We observed that, even in synaptic boutons in which the vesicular transporters were observed to co-localize with traditional light microscopy methods, UNC-17/VAChT::mRuby and CAT-1/VMAT::GFP differentially segregated when imaged using AiryScan microscopy (Figure 7H).
Together these results suggest that acetylcholine and serotonin co-localize to synapses, but might be packaged into distinct vesicles with specific synaptic subcellular localization that is detectable upon super-resolution microscopy. Our findings underscore the importance of endogenous labeling in determining the specific localization of these vesicular transporters and their use with higher-resolution imaging methods, highlighting the value of the tools developed in this study to understand the cell-biological organization of synapses in vivo, particularly for neurons using more than one neurotransmitter.
Discussion
The integration of anatomical connectivity, molecular identity, neural activity, and transmitter usage provides a powerful framework for building models of neural circuit function. TheC. eleganscommunity has access to a complete connectome ([White et al., 1986](#ref-White et al., 1986)); the cellular identity of all neurons ([Sulston and Horvitz, 1977](#ref-Sulston and Horvitz, 1977);[Sulston et al., 1983](#ref-Sulston et al., 1983)); whole-brain calcium imaging ([Nguyen et al., 2016](#ref-Nguyen et al., 2016);[Prevedel et al., 2014](#ref-Prevedel et al., 2014);[Schrödel et al., 2013](#ref-Schrödel et al., 2013)); single-cell transcriptomic profiles ([Taylor et al., 2021](#ref-Taylor et al., 2021)); and a full neurotransmitter identity map for all neurons ([Wang et al., 2024](#ref-Wang et al., 2024)). These datasets have inspired models describing how specific circuits may give rise to behavior. However, validating these models in vivo requires tools that can precisely manipulate the molecular components of individual synaptic connections ([Dag et al., 2023](#ref-Dag et al., 2023);[Hawk et al., 2018](#ref-Hawk et al., 2018);[Kumar et al., 2024](#ref-Kumar et al., 2024)). SynaptoTagMe provides that missing capability (Table 1) for the neurotransmitter systems that cover approximately 90% of theC. elegansnervous system (GABA, glutamate, acetylcholine, and the monoamines). By enabling cell-specific labeling and conditional knockout of vesicular transporters, we can now directly test the contribution of individual neurotransmitters within defined circuits and link those changes to behavioral outcomes. Moreover, due to the evolutionary conservation of vesicular transporters, the in vivo validation of tagging strategies will help identify suitable labeling strategies for other organisms, providing a path toward comparative and cross-species studies of synaptic dynamics based on neurotransmitter identity.
Co-transmission is a conserved feature of neural systems across the animal kingdom ([Granger et al., 2017](#ref-Granger et al., 2017);[Lacin et al., 2019](#ref-Lacin et al., 2019);[Vaaga et al., 2014](#ref-Vaaga et al., 2014)), but its preponderance in vivo, its regulation and its functional significance is still an area of active research. Using in vivo reporters subject to endogenous regulation, and contrasting our results with previous studies, we determine that more than 10% ofC. elegansneurons have co-transmission potential (Figure 6—figure supplement 3;Tables 2 and 3). Our in vivo characterization of co-transmitting neurons confirms and expands findings reported for the latest neurotransmitter atlas ofC. elegans([Wang et al., 2024](#ref-Wang et al., 2024)) and yield three key insights. First, co-transmission occurs throughout the nervous system ofC. elegans, including both the pharyngeal (enteric-like) and more central nervous systems, like the nerve ring and nerve cords (Table 3). Second, neurons can co-transmit multiple neurotransmitters in specific combinations that are conserved from nematodes to mammals (Figure 6,Figure 6—figure supplement 3;[Granger et al., 2017](#ref-Granger et al., 2017);[Lacin et al., 2019](#ref-Lacin et al., 2019);[Trudeau and El Mestikawy, 2018](#ref-Trudeau and El Mestikawy, 2018);[Vaaga et al., 2014](#ref-Vaaga et al., 2014);[Wang et al., 2024](#ref-Wang et al., 2024)). Importantly, the same neurons consistently exhibit co-transmission of the same neurotransmitter identities across individual animals, consistent with co-transmitter identity mapping to neuronal identity (Figure 6D–H). Third, co-transmission is part of every layer of a circuit, from sensory neurons to interneurons and motor neurons (Table 3). This is especially interesting in light of recent studies showing that co-transmission in sensory and motor circuits can be modulated by environmental cues such as stress ([Bertuzzi et al., 2018](#ref-Bertuzzi et al., 2018);[Li et al., 2024](#ref-Li et al., 2024);[Pocock and Hobert, 2010](#ref-Pocock and Hobert, 2010)) or light–dark cycles ([Chen et al., 2023](#ref-Chen et al., 2023);[Maddaloni et al., 2024](#ref-Maddaloni et al., 2024)). With the tools developed here—based on endogenously tagged vesicular transporters—it is now possible to monitor the dynamic expression and subcellular distribution of specific vesicle populations in vivo (Figure 7) and what molecular mechanisms drive those changes.
Our conclusions are supported by independent and convergent lines of evidence, and the toolkit developed here enables direct empirical interrogation of both the existence and functional relevance of co-transmission in vivo. While expression of vesicular transporters represents one line of evidence for co-transmission potential, it does not by itself establish functional co-release, which additionally depends on neurotransmitter biogenesis, release competence, and activity-dependent regulatory mechanisms. SynaptoTagMe now makes it possible to systematically test these requirements.
We note that the current characterization of co-transmitting neurons might be an underestimate of the total number of neurons which use co-transmission. For example, it has been proposed that additional neurotransmitters, like betaine, may function in theC. elegansnervous system ([Wang et al., 2024](#ref-Wang et al., 2024)). Accounting for neurons that express proteins capable of synthesizing or packaging betaine, the proportion of potential co-transmitter neurons may exceed 20% of the whole nervous system ofC. elegans. Our characterization of co-transmission focused on theC. elegansadult hermaphrodite, and co-transmitting neuron identities could be developmentally regulated, or modulated based on prior experience. Consistent with this, it has been observed that the identity of co-transmitting neurons is different between males and hermaphrodites ([Serrano-Saiz et al., 2017](#ref-Serrano-Saiz et al., 2017)), underscoring the importance of future examination of the plasticity and developmental regulation ([Pereira et al., 2019](#ref-Pereira et al., 2019);[Pereira et al., 2015](#ref-Pereira et al., 2015)) of co-transmitting capacity for individual neurons.
Expression of a vesicular transporter, while consistent with co-transmitting capacity, is not conclusive for the existence of co-transmission for that neuron. For example, we identified co-expression of the GABA and glutamate vesicular transporters in the pharyngeal neurons I2 (Figure 6—figure supplement 2A). Notably, I2 does not express the GABA synthesis enzyme,unc-25/GAD ([McIntire et al., 1993](#ref-McIntire et al., 1993)), or the GABA re-uptake transporter,snf-11([Mullen et al., 2006](#ref-Mullen et al., 2006)). Thus, it is unlikely that it produces GABA or uptakes it from the extracellular space. VGAT/UNC-47 has also been reported to transport neurotransmitters such as glycine ([Aubrey et al., 2007](#ref-Aubrey et al., 2007)) and beta-alanine ([Juge et al., 2013](#ref-Juge et al., 2013)), raising the possibility that I2 could co-transmit glutamate with an unconventional neurotransmitter. Additionally, it is important to mention that the identification ofeat-4-positive neurons through the replacement of theeat-4coding sequence and introns (Figure 6—figure supplement 1A) could result in the elimination of regulatory sequences. Thus, we conceptualize the list of co-transmitting neurons as a hypothesis-generating framework to be further examined with the tools developed in this study.
Our observations of the identity of co-transmitting neurons, and the specific combinations represented in the neurons, suggest that there may be transmitter-specific rules of synaptic biology important for circuit function ([Silm et al., 2019](#ref-Silm et al., 2019);[Trudeau and El Mestikawy, 2018](#ref-Trudeau and El Mestikawy, 2018)). This is consistent with findings in vertebrates, in which specific neurotransmitter combinations and their distributions could underpin specific features of circuit function. For example, in starburst amacrine cells in the mammalian retina, acetylcholine and GABA ([O’Malley et al., 1992](#ref-O’Malley et al., 1992)) are packaged into distinct vesicle pools that exhibit different calcium sensitivities for release ([Lee et al., 2010](#ref-Lee et al., 2010)). The distribution of specific vesicular populations and their release probabilities might constitute an architecture that helps encode the sensory signals processed by starburst amacrine cells. We similarly hypothesize that the specific distribution of co-transmitting synapses across theC. elegansconnectome, and the identities of the neurotransmitters used, might help encode features important for circuit function and animal behavior. By allowing longitudinal, cell-specific monitoring of the expression, regulation, and subsynaptic distribution of distinct vesicle populations in living animals, this toolkit provides a platform for probing when, where, and how co-transmission is deployed, and for defining the molecular and circuit-level mechanisms that govern its use under different physiological and environmental conditions.
Methods
Strains
Worms were maintained at 20°C using standard techniques ([Brenner, 1973](#ref-Brenner, 1973)). Strains were maintained on Nematode Growth Medium (NGM) plates seeded withE. coli(OP-50). The wild type (WT) is N2, and only hermaphrodite worms were used for this study. A complete list of strains appears below. Strains that were developed in this study as part of the SynaptoTagMe toolkit and appear inTable 1can be requested through CGC. The necessary sequencing information can be foundhere.
Generation of new alleles
For the strains engineered by Sunybiotech, as described below, strain design was performed in the Colón-Ramos lab by Andrea Cuentas-Condori.
Sunybiotech used CRISPR/Cas9 to insert GFP FLP-on cassettes ([Schwartz and Jorgensen, 2016](#ref-Schwartz and Jorgensen, 2016)) at either the N-termini of theunc-17locus (syb7251) or C-termini end of theunc-17 (ola503), oreat-4 (syb8568)locus, according to sequence design. mRuby3 FLP-on cassettes were inserted similarly at the C-termini end ofeat-4(syb9193) andunc-17(syb7882) locus. To visualize the fluorescent signal tagged to the protein of interest, Sunybiotech generated single-copy MosCI strains.
Sunybiotech used CRISPR/Cas9 to add full-length GFP (syb6990), full-length mKate (syb7358), or split GFP (one (syb7313) or three (syb7849) copies of GFP11) to theunc-47locus at the +893 bp position. To visualize the reconstituted GFP signal in RIB neurons, complementary GFP1-10 was driven with the Psto-3bpromoter; and to visualize the GFP-reconstituted signal in DD neurons, GFP1-10 was driven with the Pflp-13promoter.
Sunybiotech used CRISPR/Cas9 to introduce an FRT site before the +1 bp in theunc-25gene locus (syb5949). In a second round of CRISPR editing, they introducedlet-8583’ UTR followed by a second FRT and nuclear mCherry (syb6275).
cat-1(ky1101 ky1118) cell-specific knockout strain was created using CRISPR/Cas9 to introduce an FRT site immediately before the ATG in thecat-1gene locus (ky1101). A second round of CRISPR editing in that strain introduced thelet-8583’ UTR followed by a second FRT and the mCherry coding region immediately after the stop codon ofcat-1to generateky1118.
Sunybiotech used CRISPR/Cas9 to introduce a T2A::Flippase sequence before the STOP codon ofunc-47(syb8125)andunc-17(syb8059). All strains generated using CRISPR/Cas9 were outcrossed twice before use.
Molecular biology
Plasmids were constructed using Gibson cloning. First, Snapgene (Version 7.0.3) software was used to design primers targeting the desired DNA vector backbone and DNA insert. The vector backbone and DNA insert were PCR linearized and amplified using ‘CloneAmp HiFi PCR Premix’. To assemble the desired plasmid, the purified vector backbone DNA and insert DNA were combined and incubated in solution with ‘2x Gibson Assembly Enzyme Premix’. Following incubation, the reaction mixture was used to transform Stellar Competent Cells, which were subsequently plated and grown overnight on LB-Amp plates. All plasmids were verified with Sanger sequencing.
Protein alignment and structure visualization
For each gene under study, NCBI BLAST was used to generate a protein sequence alignment of theC. elegansgene with the closest orthologs from the other model organismsM. musculus,D. rerio,D. melanogaster, andH. sapiens. Protein structure models for theC. elegansgenes were downloaded from the AlphaFold database ([Jumper et al., 2021](#ref-Jumper et al., 2021)) and predicted models for the CRISPR-Cas9 modified genes including fluorophores were generated by the Alphafold3 online server ([Abramson et al., 2024](#ref-Abramson et al., 2024)). Visualization and image generation of protein structures was done using the ChimeraX software ([Pettersen et al., 2021](#ref-Pettersen et al., 2021)). To color the structures by sequence conservation, the alignments per gene were overlaid onto the structures with ChimeraX and colored by resulting sequence conservationZ-scores as calculated by the AL2CO algorithm ([Pei and Grishin, 2001](#ref-Pei and Grishin, 2001)) within the software.
Microscopy
Larval or young adult animals were immobilized on 2–10% agarose pads with 10 mM levamisole. A Nikon Ti2 microscope equipped with a CSU-W1 spinning disk head, ORCA-Fusion BT SCMOS camera, high-speed piezo stage motor, 60X/1.40 Apo Lambda oil objective lens was used for live imaging. Z-stack images were collected (0.3–0.5 μm/step), spanning the focal depth of the nerve cord and nerve ring synapses. A Zeiss LSM880 microscope equipped with an AiryScan detector and 63X NA 1.4 oil objective was used for AiryScan imaging. FIJI ([Schindelin et al., 2012](#ref-Schindelin et al., 2012)) or NIS Elements AR analysis software (version 6.10.01) were used to create maximum intensity projections and 2D renderings.
Thrashing assay
C. eleganswere raised at 20°C under standard laboratory conditions on agar plates seeded with a lawn ofE. coli(OP50). Worms were synchronously grown to L4-stage and placed in individual wells of a Corning PYREX Spot Plate (Catalog #722085) containing 1000 μl of M9 buffer, ensuring the buffer remained within the well’s borders. After a 30-s acclimation period to M9, thrashes were manually counted for 1 min. A single thrash was defined as a change in the direction of the worm’s midbody bending, counting each time the worm’s body flexed to one side. Following each trial, the worm was removed using a pipette and disposed of, and the M9 buffer was absorbed and discarded. The well was then cleaned with 70% ethanol and wiped dry. To avoid bias, the counter was blinded to each genotype. Each worm was tested only once, with assays conducted on 10 worms per genotype per day, and repeated over 2–3 days to account for potential day-to-day environmental variations.
Chemotaxis assay
Worms were maintained at 20°C for at least two generations on NGM seeded with OP50Escherichia colibacteria. The concentration of our attractant (NaCl) is approximately 50 mM in NGM plates. ‘Training’ plates were produced using NGM with the further addition of 50 mM NaCl to a total concentration of 100 mM, then also seeded with OP50.
Chemotaxis assay was modified from standard procedure ([Ward, 1973](#ref-Ward, 1973)). All assays were performed on 50 mm diameter plates. Unseeded NGM plates were marked at the center and one point 12.5 mm away from the center. A ~60–85 mM gradient of NaCl was created between the center and outer point by adding 5 M NaCl at the outer point as drops of 4 μl (20–24 hr before the assay), 4 μl (5 hr before), and 1.6 μl (2 hr before); a sham gradient was created using only water. Gradient prediction was determined as previously described ([Crank, 1956](#ref-Crank, 1956);[Pierce-Shimomura et al., 1999](#ref-Pierce-Shimomura et al., 1999)); briefly, for every point some distancerin cm from the salt peak, the concentrationCin mM at any point in time was calculated as:
whereCois the initial concentration of NaCl in the agar (50 mM),nis the drop number, andtiis the time in seconds since the drop had been applied; the contribution from each drop, in turn, was calculated as:
whereNiis the moles of NaCl added per drop;dis the depth (cm) of the agar; andDis 1.590 × 10⁻⁵cm2/s, the diffusion coefficient for 5 M NaCl through an aqueous medium ([Robinson and Stokes, 1959](#ref-Robinson and Stokes, 1959)). The resulting gradients were validated by electrical conductivity measurements using an Oakton CON 6+ Handheld Conductivity Meter with a custom conductivity probe with 1 mm insertion depth (Micro-electrodes, Inc, Bedford, NH). The conductivity readings from 50 and 100 mM NaCl NGM plates were used for calibration at specific room temperatures.
The day before experiments, L4 animals were transferred to a seeded NGM plate to synchronize worms by developmental stage. At 5 hr before each assay, worms were transferred to a training plate using standard NGM plate recipe adjusted to 100 mM NaCl. After training, eight worms were picked, with preference to those on the bacterial lawn, washed sequentially in two 100 µl drops of liquid NGM buffer (25 mM potassium phosphate pH 6, 1 mM CaCl2, 1 mM MgSO4, 50 mM NaCl) to remove adherent OP50, and transferred to a single 2 μl drop of NGM buffer at the center of the assay plate with prepared NaCl gradient as described. Data collection began when the water drop was fully absorbed into the assay plate and the first worm began to migrate from its starting point. Six assay plates were imaged for each strain across two separate days, yielding a total of 48 worms imaged per strain.
Images of chemotaxis behavior were acquired at 3.75 fps for 7 min using a Basler acA2440-35mm monochromatic sensor with an infrared filter on a commercially available WormLab imaging system and computer running WormLab 2023.1.1 software (MBF Bioscience LLC, Williston, VT USA). Individual worm position data was obtained by constructing tracks in WormLab software, then analyzed using custom scripts in R 4.4.1 (can be accessed through GitHub;https://github.com/colonramoslab/Cuentas-Condori-et-al.-2025-Toolkit-; copy archived at[Thomas, 2025](#ref-Thomas, 2025)). The assay outcome was defined as the mean distance from the peak of the salt gradient for each worm, averaged over every available frame in the last minute of the assay. When a worm track was interrupted, e.g. by a worm exiting the camera field of view or by two worms intersecting, the last available position for the worm was repeated until the worm was re-detected.
Roaming assay
Roaming assay plates were prepared 3–5 days prior to the experiment by seeding NGM agar plates withE. coli(OP50) culture no older than 2 days. Plates were seeded using a sterile glass rod to spread the bacteria evenly across each plate. Plates were left to dry completely between 3 and 5 days at room temperature to ensure the bacteria layer was fully dry, thereby allowing for visible worm tracks during the assay.C. eleganswere raised at 20°C under standard laboratory conditions on agar plates seeded with a lawn ofE. coli(OP50). On the day before the assay, worms synchronously grown to L4-stage were transferred to regular seeded plates and stored at 20°C. After approximately 10 hr, worms were transferred to individual assay plates and incubated at 20°C for 16 hr. After this time, worms were removed and a grid overlay (3 mm × 3 mm squares) covering the assay plate was used to count the number of squares the worms had traversed during the incubation period. The number of squares crossed provided a quantifiable measure of roaming activity. To avoid bias, the counter was blinded to each genotype. Each worm was tested only once, with assays conducted on 10 worms per genotype per day and repeated over 2–3 days to account for potential day-to-day environmental variations.
Aversion behavior assay
Aversion behavior assay were performed as previously described ([Feng et al., 2025](#ref-Feng et al., 2025)). Animals were fed onE. coliBW25113 for at least three generations before the behavioral assay. 12.5 μl of overnight BW25113 cultures were seeded onto standard NGM agar plates, grown at 37°C in an incubator for 24 hr and then left at room temperature for another 24 hr. 15–20 animals at L4 stages from each genotype were transferred onto behavioral assay plates and recorded at 21°C for 20 hr, at a recording rate of 1 frame per minute. Biological replicates across two different days were conducted. Videos were cropped and analyzed using standard MatLab codes ([Marquina-Solis et al., 2024](#ref-Marquina-Solis et al., 2024)). Aversion ratio was defined by the number of worms outside the bacterial lawn over the total number of worms on assay plates.
Statistical analysis
We used the Shapiro–Wilk test to determine sample distribution. For comparisons between two normally distributed groups, Student’st-test was used and p < 0.05 was considered significant. ANOVA was used to compare between three or more normally distributed groups followed by Dunnett’s multiple-comparison test. If the samples were not normally distributed, we used a Mann–Whitney test to compare two groups and a Kruskal–Wallis test to compare three or more groups. Specific post hoc statistical tests are listed in the figure legend of each experiment. Prism 10.4.2 was used to graph the data and for all statistical analysis.
Acknowledgements
We thank Nuria Flames Bonilla (Instituto de Biomedicina de Valencia, Spain), Rafa Alis (Instituto de Biomedicina de Valencia, Spain), Steven Flavell (MIT), and Yung-Chi Huang (MIT) for sharing reagents and constructs. We thank James Rand, Oliver Hobert (Columbia University), and Chen Wang (Columbia University) for sharing unpublished observations. We thank Ian Gonzalez for the creation of the name for this toolkit. We thank members of the Colón-Ramos Lab for feedback on figures and the manuscript. We also thank Stacy Wilson for technical support and training using the AiryScan imaging setup as part of the Yale Neuroscience Imaging Core Facility. We also thank Emerson Santiago, member of the Koelle Lab (Yale University), for expert advice on assays of serotonin function. Some strains were provided by the CGC, which is funded by NIH Office of Research Infrastructure Programs (P40 OD010440). This work was supported by National Institutes of Health grants to DC-R (R35NS132156 and R01NS076558) and to AW (K99AG083129), to EMJ (R01 NS034307), and to MLS (F32GM133139). The Pew Latin American Fellowship to ACC (AWD0006561), the Jane Coffin Childs Fellowship to ACC (AWD0006564), the HHMI Hanna Gray Fellowship to ACC (GT15993), and the Chan Zuckerberg Initiative to CIB. ACC was supported by The Pew Foundation, the Jane Coffin Childs, HHMI-HGF AW was supported by K99AG083129. DC-R, PC-L, and MT were supported by R35NS132156 and R01NS076558. MLS was supported by F32GM133139. EMJ was supported by R01 NS034307, R01 GM095817, and HHMI MB, MSE, LF, and CB were supported by a grant from the Chan Zuckerberg Initiative.
Funding Statement
The funders had no role in study design, data collection, and interpretation, or the decision to submit the work for publication.
Contributor Information
Daniel A Colón-Ramos, Email: daniel.colon-ramos@yale.edu.
Kavita Babu, Indian Institute of Science Bangalore, India.
Albert Cardona, University of Cambridge, United Kingdom.
Funding Information
This paper was supported by the following grants:
Additional information
Data availability
The source data file contains all numerical data used to generateFigure 2C, Figure 2 - Supplement 1, Figure 3E, Figure 3 - Supplement 1, Figure 3 - Supplement 2, Figure 4C, Figure 4 - Supplement 1, Figure 4 - Supplement 2, Figure 5D, and Figure 5E. All raw datasets used for three-dimensional electron microscopy reconstructions were previously generated and are available through WormAtlas (https://wormatlas.org/MoW_built0.92/MoW.html;[White et al., 1986](#ref-White et al., 1986)). Electron microscopy reconstructions ofC. elegansare also accessible via the NeuroSC platform (https://neurosc.net/).
The following previously published dataset was used:
Taylor SR, Santpere G, Weinreb A, Barrett A, Reilly MB, Xu C, Varol E, Oikonomou P, Glenwinkel L, McWhirter R, Poff A, Basavaraju M, Rafi I, Yemini E, Cook SJ, Abrams A, Vidal B, Cros C, Tavazoie S, Sestan N, Hammarlund M, Hobert O, Miller DM. 2019. Molecular topography of an entire nervous system. NCBI Gene Expression Omnibus. GSE136049
References
- Abramson J, Adler J, Dunger J, Evans R, Green T, Pritzel A, Ronneberger O, Willmore L, Ballard AJ, Bambrick J, Bodenstein SW, Evans DA, Hung C-C, O’Neill M, Reiman D, Tunyasuvunakool K, Wu Z, Žemgulytė A, Arvaniti E, Beattie C, Bertolli O, Bridgland A, Cherepanov A, Congreve M, Cowen-Rivers AI, Cowie A, Figurnov M, Fuchs FB, Gladman H, Jain R, Khan YA, Low CMR, Perlin K, Potapenko A, Savy P, Singh S, Stecula A, Thillaisundaram A, Tong C, Yakneen S, Zhong ED, Zielinski M, Žídek A, Bapst V, Kohli P, Jaderberg M, Hassabis D, Jumper JM. Accurate structure prediction of biomolecular interactions with AlphaFold 3. Nature. 2024;630:493–500. doi.org/10.1038/s41586-024-07487-w
- Ahier A, Jarriault S. Simultaneous expression of multiple proteins under a single promoter in Caenorhabditis elegans via a versatile 2A-based toolkit. Genetics. 2014;196:605–613. doi.org/10.1534/genetics.113.160846
- Albertson DG, Thomson JN. The pharynx of Caenorhabditis elegans. Philosophical Transactions of the Royal Society of London. Series B, Biological Sciences. 1976;275:299–325. doi.org/10.1098/rstb.1976.0085
- Alfonso A, Grundahl K, Duerr JS, Han HP, Rand JB. The Caenorhabditis elegans unc-17 gene: a putative vesicular acetylcholine transporter. Science. 1993;261:617–619. doi.org/10.1126/science.8342028
- Alkema MJ, Hunter-Ensor M, Ringstad N, Horvitz HR. Tyramine functions independently of octopamine in the Caenorhabditis elegans nervous system. Neuron. 2005;46:247–260. doi.org/10.1016/j.neuron.2005.02.024
- Aubrey KR, Rossi FM, Ruivo R, Alboni S, Bellenchi GC, Le Goff A, Gasnier B, Supplisson S. The transporters GlyT2 and VIAAT cooperate to determine the vesicular glycinergic phenotype. The Journal of Neuroscience. 2007;27:6273–6281. doi.org/10.1523/JNEUROSCI.1024-07.2007
- Bajar BT, Wang ES, Lam AJ, Kim BB, Jacobs CL, Howe ES, Davidson MW, Lin MZ, Chu J. Improving brightness and photostability of green and red fluorescent proteins for live cell imaging and FRET reporting. Scientific Reports. 2016;6:20889. doi.org/10.1038/srep20889
- Bargmann CI, Horvitz HR. Chemosensory neurons with overlapping functions direct chemotaxis to multiple chemicals in C. elegans. Neuron. 1991;7:729–742. doi.org/10.1016/0896-6273(91)90276-6
- Bellocchio EE, Hu H, Pohorille A, Chan J, Pickel VM, Edwards RH. The localization of the brain-specific inorganic phosphate transporter suggests a specific presynaptic role in glutamatergic transmission. The Journal of Neuroscience. 1998;18:8648–8659. doi.org/10.1523/JNEUROSCI.18-21-08648.1998
- Bertuzzi M, Chang W, Ampatzis K. Adult spinal motoneurons change their neurotransmitter phenotype to control locomotion. PNAS. 2018;115:E9926–E9933. doi.org/10.1073/pnas.1809050115
- Brenner S. The genetics of Caenorhabidits elegans. Genetics. 1973;77:77.1.71. doi.org/10.1093/genetics/77.1.71
- Chaudhry FA, Reimer RJ, Bellocchio EE, Danbolt NC, Osen KK, Edwards RH, Storm-Mathisen J. The vesicular GABA transporter, VGAT, localizes to synaptic vesicles in sets of glycinergic as well as GABAergic neurons. The Journal of Neuroscience. 1998;18:9733–9750. doi.org/10.1523/JNEUROSCI.18-23-09733.1998
- Chen N, Zhang Y, Rivera-Rodriguez EJ, Yu AD, Hobin M, Rosbash M, Griffith LC. Widespread posttranscriptional regulation of cotransmission. Science Advances. 2023;9:eadg9836. doi.org/10.1126/sciadv.adg9836
- Crank J. The Mathematics of Diffusion. Clarendon Press; 1956.
- Crawford DC, Kavalali ET. Molecular underpinnings of synaptic vesicle pool heterogeneity. Traffic. 2015;16:338–364. doi.org/10.1111/tra.12262
- Dag U, Nwabudike I, Kang D, Gomes MA, Kim J, Atanas AA, Bueno E, Estrem C, Pugliese S, Wang Z, Towlson E, Flavell SW. Dissecting the functional organization of the C. elegans serotonergic system at whole-brain scale. Cell. 2023;186:2574–2592. doi.org/10.1016/j.cell.2023.04.023
- Duerr JS, Frisby DL, Gaskin J, Duke A, Asermely K, Huddleston D, Eiden LE, Rand JB. The cat-1 gene of Caenorhabditis elegans encodes a vesicular monoamine transporter required for specific monoamine-dependent behaviors. The Journal of Neuroscience. 1999;19:72–84. doi.org/10.1523/JNEUROSCI.19-01-00072.1999
- Duerr JS, Gaskin J, Rand JB. Identified neurons in C. elegans coexpress vesicular transporters for acetylcholine and monoamines. American Journal of Physiology. Cell Physiology. 2001;280:C1616–C1622. doi.org/10.1152/ajpcell.2001.280.6.C1616
- Duerr JS, Han HP, Fields SD, Rand JB. Identification of major classes of cholinergic neurons in the nematode Caenorhabditis elegans. The Journal of Comparative Neurology. 2008;506:398–408. doi.org/10.1002/cne.21551
- Edwards RH. The neurotransmitter cycle and quantal size. Neuron. 2007;55:835–858. doi.org/10.1016/j.neuron.2007.09.001
- Eiden LE. The cholinergic gene locus. Journal of Neurochemistry. 1998;70:2227–2240. doi.org/10.1046/j.1471-4159.1998.70062227.x
- Erickson JD, Eiden LE, Hoffman BJ. Expression cloning of a reserpine-sensitive vesicular monoamine transporter. PNAS. 1992;89:10993–10997. doi.org/10.1073/pnas.89.22.10993
- Fei H, Grygoruk A, Brooks ES, Chen A, Krantz DE. Trafficking of vesicular neurotransmitter transporters. Traffic. 2008;9:1425–1436. doi.org/10.1111/j.1600-0854.2008.00771.x
- Feng L, Marquina-Solis J, Yue L, Harnagel A, Greenfeld Y, Bargmann CI. Context-dependent serotonin signaling links dietary quality to foraging decisions. Nature Communications. 2025;16:10479. doi.org/10.1038/s41467-025-65491-8
- Flavell SW, Pokala N, Macosko EZ, Albrecht DR, Larsch J, Bargmann CI. Serotonin and the neuropeptide PDF initiate and extend opposing behavioral states in C. elegans. Cell. 2013;154:1023–1035. doi.org/10.1016/j.cell.2013.08.001
- Gendrel M, Atlas EG, Hobert O. A cellular and regulatory map of the GABAergic nervous system of C. elegans. eLife. 2016;5:e17686. doi.org/10.7554/eLife.17686
- Gouwens NW, Sorensen SA, Baftizadeh F, Budzillo A, Lee BR, Jarsky T, Alfiler L, Baker K, Barkan E, Berry K, Bertagnolli D, Bickley K, Bomben J, Braun T, Brouner K, Casper T, Crichton K, Daigle TL, Dalley R, de Frates RA, Dee N, Desta T, Lee SD, Dotson N, Egdorf T, Ellingwood L, Enstrom R, Esposito L, Farrell C, Feng D, Fong O, Gala R, Gamlin C, Gary A, Glandon A, Goldy J, Gorham M, Graybuck L, Gu H, Hadley K, Hawrylycz MJ, Henry AM, Hill D, Hupp M, Kebede S, Kim TK, Kim L, Kroll M, Lee C, Link KE, Mallory M, Mann R, Maxwell M, McGraw M, McMillen D, Mukora A, Ng L, Ng L, Ngo K, Nicovich PR, Oldre A, Park D, Peng H, Penn O, Pham T, Pom A, Popović Z, Potekhina L, Rajanbabu R, Ransford S, Reid D, Rimorin C, Robertson M, Ronellenfitch K, Ruiz A, Sandman D, Smith K, Sulc J, Sunkin SM, Szafer A, Tieu M, Torkelson A, Trinh J, Tung H, Wakeman W, Ward K, Williams G, Zhou Z, Ting JT, Arkhipov A, Sümbül U, Lein ES, Koch C, Yao Z, Tasic B, Berg J, Murphy GJ, Zeng H. Integrated morphoelectric and transcriptomic classification of cortical GABAergic cells. Cell. 2020;183:935–953. doi.org/10.1016/j.cell.2020.09.057
- Granger AJ, Wallace ML, Sabatini BL. Multi-transmitter neurons in the mammalian central nervous system. Current Opinion in Neurobiology. 2017;45:85–91. doi.org/10.1016/j.conb.2017.04.007
- Hall DH, Hedgecock EM. Kinesin-related gene unc-104 is required for axonal transport of synaptic vesicles in C. elegans. Cell. 1991;65:837–847. doi.org/10.1016/0092-8674(91)90391-b
- Hawk JD, Calvo AC, Liu P, Almoril-Porras A, Aljobeh A, Torruella-Suárez ML, Ren I, Cook N, Greenwood J, Luo L, Wang ZW, Samuel ADT, Colón-Ramos DA. Integration of plasticity mechanisms within a single sensory neuron of C. elegans actuates a memory. Neuron. 2018;97:356–367. doi.org/10.1016/j.neuron.2017.12.027
- He S, Cuentas-Condori A, Miller DM. NATF (Native and Tissue-Specific Fluorescence): A strategy for bright, tissue-specific GFP labeling of native proteins in Caenorhabditis elegans. Genetics. 2019;212:387–395. doi.org/10.1534/genetics.119.302063
- Huang YC, Luo J, Huang W, Baker CM, Gomes MA, Meng B, Byrne AB, Flavell SW. A single neuron in C. elegans orchestrates multiple motor outputs through parallel modes of transmission. Current Biology. 2023;33:4430–4445. doi.org/10.1016/j.cub.2023.08.088
- Jafari G, Xie Y, Kullyev A, Liang B, Sze JY. Regulation of extrasynaptic 5-HT by serotonin reuptake transporter function in 5-HT-absorbing neurons underscores adaptation behavior in Caenorhabditis elegans. The Journal of Neuroscience. 2011;31:8948–8957. doi.org/10.1523/JNEUROSCI.1692-11.2011
- Juge N, Omote H, Moriyama Y. Vesicular GABA transporter (VGAT) transports β-alanine. Journal of Neurochemistry. 2013;127:482–486. doi.org/10.1111/jnc.12393
- Jumper J, Evans R, Pritzel A, Green T, Figurnov M, Ronneberger O, Tunyasuvunakool K, Bates R, Žídek A, Potapenko A, Bridgland A, Meyer C, Kohl SAA, Ballard AJ, Cowie A, Romera-Paredes B, Nikolov S, Jain R, Adler J, Back T, Petersen S, Reiman D, Clancy E, Zielinski M, Steinegger M, Pacholska M, Berghammer T, Bodenstein S, Silver D, Vinyals O, Senior AW, Kavukcuoglu K, Kohli P, Hassabis D. Highly accurate protein structure prediction with AlphaFold. Nature. 2021;596:583–589. doi.org/10.1038/s41586-021-03819-2
- Kamalova A, Nakagawa T. AMPA receptor structure and auxiliary subunits. The Journal of Physiology. 2021;599:453–469. doi.org/10.1113/JP278701
- Koonce NL, Emerson SE, Bhaskar D, Kuchroo M, Moyle MW, Arroyo-Morales P, Martínez NV, Emerson JI, Krishnaswamy S, Mohler W, Colón-Ramos D. NeuroSC: exploring neurodevelopment via spatiotemporal collation of anatomical networks. bioRxiv. 2024 doi.org/10.1101/2024.08.27.609993
- Kumar S, Sharma AK, Leifer AM. An inhibitory acetylcholine receptor gates context-dependent mechanosensory processing in C. elegans. iScience. 2024;27:110776. doi.org/10.1016/j.isci.2024.110776
- Lacin H, Chen HM, Long X, Singer RH, Lee T, Truman JW. Neurotransmitter identity is acquired in a lineage-restricted manner in the Drosophila CNS. eLife. 2019;8:e43701. doi.org/10.7554/eLife.43701
- Lee RY, Sawin ER, Chalfie M, Horvitz HR, Avery L. EAT-4, a homolog of a mammalian sodium-dependent inorganic phosphate cotransporter, is necessary for glutamatergic neurotransmission in Caenorhabditis elegans. The Journal of Neuroscience. 1999;19:159–167. doi.org/10.1523/JNEUROSCI.19-01-00159.1999
- Lee S, Kim K, Zhou ZJ. Role of ACh-GABA cotransmission in detecting image motion and motion direction. Neuron. 2010;68:1159–1172. doi.org/10.1016/j.neuron.2010.11.031
- Li HQ, Pratelli M, Godavarthi S, Zambetti S, Spitzer NC. Decoding neurotransmitter switching: the road forward. The Journal of Neuroscience. 2020;40:4078–4089. doi.org/10.1523/JNEUROSCI.0005-20.2020
- Li H-Q, Jiang W, Ling L, Pratelli M, Chen C, Gupta V, Godavarthi SK, Spitzer NC. Generalized fear after acute stress is caused by change in neuronal cotransmitter identity. Science. 2024;383:1252–1259. doi.org/10.1126/science.adj5996
- Liu C, Goel P, Kaeser PS. Spatial and temporal scales of dopamine transmission. Nature Reviews. Neuroscience. 2021;22:345–358. doi.org/10.1038/s41583-021-00455-7
- López-Cruz A, Sordillo A, Pokala N, Liu Q, McGrath PT, Bargmann CI. Parallel multimodal circuits control an innate foraging behavior. Neuron. 2019;102:407–419. doi.org/10.1016/j.neuron.2019.01.053
- Maddaloni G, Chang YJ, Senft RA, Dymecki SM. Adaptation to photoperiod via dynamic neurotransmitter segregation. Nature. 2024;632:147–156. doi.org/10.1038/s41586-024-07692-7
- Maicas M, Jimeno-Martín Á, Millán-Trejo A, Alkema MJ, Flames N. The transcription factor LAG-1/CSL plays a Notch-independent role in controlling terminal differentiation, fate maintenance, and plasticity of serotonergic chemosensory neurons. PLOS Biology. 2021;19:e3001334. doi.org/10.1371/journal.pbio.3001334
- Marquina-Solis J, Feng L, Vandewyer E, Beets I, Hawk J, Colón-Ramos DA, Yu J, Fox BW, Schroeder FC, Bargmann CI. Antagonism between neuropeptides and monoamines in a distributed circuit for pathogen avoidance. Cell Reports. 2024;43:114042. doi.org/10.1016/j.celrep.2024.114042
- Martens H, Weston MC, Boulland J-L, Grønborg M, Grosche J, Kacza J, Hoffmann A, Matteoli M, Takamori S, Harkany T, Chaudhry FA, Rosenmund C, Erck C, Jahn R, Härtig W. Unique luminal localization of VGAT-C terminus allows for selective labeling of active cortical GABAergic synapses. The Journal of Neuroscience. 2008;28:13125–13131. doi.org/10.1523/JNEUROSCI.3887-08.2008
- Mathews EA, Mullen GP, Manjarrez JR, Rand JB. Unusual regulation of splicing of the cholinergic locus in Caenorhabditis elegans. Genetics. 2015;199:729–737. doi.org/10.1534/genetics.114.173765
- McIntire SL, Jorgensen E, Kaplan J, Horvitz HR. The GABAergic nervous system of Caenorhabditis elegans. Nature. 1993;364:337–341. doi.org/10.1038/364337a0
- McIntire SL, Reimer RJ, Schuske K, Edwards RH, Jorgensen EM. Identification and characterization of the vesicular GABA transporter. Nature. 1997;389:870–876. doi.org/10.1038/39908
- Mclntire SL, Jorgensen E, Horvitz HR. Genes required for GABA function in Caenorhabditis elegans. Nature. 1993;364:334–337. doi.org/10.1038/364334a0
- Morrie RD, Feller MB. An asymmetric increase in inhibitory synapse number underlies the development of a direction selective circuit in the retina. The Journal of Neuroscience. 2015;35:9281–9286. doi.org/10.1523/JNEUROSCI.0670-15.2015
- Mullen GP, Mathews EA, Saxena P, Fields SD, McManus JR, Moulder G, Barstead RJ, Quick MW, Rand JB. The Caenorhabditis elegans snf-11 gene encodes a sodium-dependent GABA transporter required for clearance of synaptic GABA. Molecular Biology of the Cell. 2006;17:3021–3030. doi.org/10.1091/mbc.e06-02-0155
- Muñoz-Jiménez C, Ayuso C, Dobrzynska A, Torres-Mendéz A, Ruiz PC, Askjaer P. An Efficient FLP-based toolkit for spatiotemporal control of gene expression in. Genetics. 2017;206:1763–1778. doi.org/10.1534/genetics.117.201012
- Nguyen JP, Shipley FB, Linder AN, Plummer GS, Liu M, Setru SU, Shaevitz JW, Leifer AM. Whole-brain calcium imaging with cellular resolution in freely behaving Caenorhabditis elegans. PNAS. 2016;113:E1074–E1081. doi.org/10.1073/pnas.1507110112
- O’Malley DM, Sandell JH, Masland RH. Co-release of acetylcholine and GABA by the starburst amacrine cells. The Journal of Neuroscience. 1992;12:1394–1408. doi.org/10.1523/JNEUROSCI.12-04-01394.1992
- Pei J, Grishin NV. AL2CO: calculation of positional conservation in a protein sequence alignment. Bioinformatics. 2001;17:700–712. doi.org/10.1093/bioinformatics/17.8.700
- Pereira L, Kratsios P, Serrano-Saiz E, Sheftel H, Mayo AE, Hall DH, White JG, LeBoeuf B, Garcia LR, Alon U, Hobert O. A cellular and regulatory map of the cholinergic nervous system of C. elegans. eLife. 2015;4:e12432. doi.org/10.7554/eLife.12432
- Pereira L, Aeschimann F, Wang C, Lawson H, Serrano-Saiz E, Portman DS, Großhans H, Hobert O. Timing mechanism of sexually dimorphic nervous system differentiation. eLife. 2019;8:e42078. doi.org/10.7554/eLife.42078
- Pettersen EF, Goddard TD, Huang CC, Meng EC, Couch GS, Croll TI, Morris JH, Ferrin TE. UCSF ChimeraX: Structure visualization for researchers, educators, and developers. Protein Science. 2021;30:70–82. doi.org/10.1002/pro.3943
- Pierce-Shimomura JT, Morse TM, Lockery SR. The fundamental role of pirouettes in Caenorhabditis elegans chemotaxis. The Journal of Neuroscience. 1999;19:9557–9569. doi.org/10.1523/JNEUROSCI.19-21-09557.1999
- Pocock R, Hobert O. Hypoxia activates a latent circuit for processing gustatory information in C. elegans. Nature Neuroscience. 2010;13:610–614. doi.org/10.1038/nn.2537
- Prevedel R, Yoon Y-G, Hoffmann M, Pak N, Wetzstein G, Kato S, Schrödel T, Raskar R, Zimmer M, Boyden ES, Vaziri A. Simultaneous whole-animal 3D imaging of neuronal activity using light-field microscopy. Nature Methods. 2014;11:727–730. doi.org/10.1038/nmeth.2964
- Reilly MB, Tekieli T, Cros C, Aguilar GR, Lao J, Toker IA, Vidal B, Leyva-Díaz E, Bhattacharya A, Cook SJ, Smith JJ, Kovacevic I, Gulez B, Fernandez RW, Bradford EF, Ramadan YH, Kratsios P, Bao Z, Hobert O. Widespread employment of conserved C. elegans homeobox genes in neuronal identity specification. PLOS Genetics. 2022;18:e1010372. doi.org/10.1371/journal.pgen.1010372
- Robinson RA, Stokes R. Electrolyte Solutions. Academic Press; 1959.
- Roghani A, Feldman J, Kohan SA, Shirzadi A, Gundersen CB, Brecha N, Edwards RH. Molecular cloning of a putative vesicular transporter for acetylcholine. PNAS. 1994;91:10620–10624. doi.org/10.1073/pnas.91.22.10620
- Santos MS, Park CK, Foss SM, Li H, Voglmaier SM. Sorting of the vesicular GABA transporter to functional vesicle pools by an atypical dileucine-like motif. The Journal of Neuroscience. 2013;33:10634–10646. doi.org/10.1523/JNEUROSCI.0329-13.2013
- Sato H, Kunitomo H, Fei X, Hashimoto K, Iino Y. Glutamate signaling from a single sensory neuron mediates experience-dependent bidirectional behavior in Caenorhabditis elegans. Cell Reports. 2021;35:109177. doi.org/10.1016/j.celrep.2021.109177
- Scheffer LK, Xu CS, Januszewski M, Lu Z, Takemura S-Y, Hayworth KJ, Huang GB, Shinomiya K, Maitlin-Shepard J, Berg S, Clements J, Hubbard PM, Katz WT, Umayam L, Zhao T, Ackerman D, Blakely T, Bogovic J, Dolafi T, Kainmueller D, Kawase T, Khairy KA, Leavitt L, Li PH, Lindsey L, Neubarth N, Olbris DJ, Otsuna H, Trautman ET, Ito M, Bates AS, Goldammer J, Wolff T, Svirskas R, Schlegel P, Neace E, Knecht CJ, Alvarado CX, Bailey DA, Ballinger S, Borycz JA, Canino BS, Cheatham N, Cook M, Dreher M, Duclos O, Eubanks B, Fairbanks K, Finley S, Forknall N, Francis A, Hopkins GP, Joyce EM, Kim S, Kirk NA, Kovalyak J, Lauchie SA, Lohff A, Maldonado C, Manley EA, McLin S, Mooney C, Ndama M, Ogundeyi O, Okeoma N, Ordish C, Padilla N, Patrick CM, Paterson T, Phillips EE, Phillips EM, Rampally N, Ribeiro C, Robertson MK, Rymer JT, Ryan SM, Sammons M, Scott AK, Scott AL, Shinomiya A, Smith C, Smith K, Smith NL, Sobeski MA, Suleiman A, Swift J, Takemura S, Talebi I, Tarnogorska D, Tenshaw E, Tokhi T, Walsh JJ, Yang T, Horne JA, Li F, Parekh R, Rivlin PK, Jayaraman V, Costa M, Jefferis GS, Ito K, Saalfeld S, George R, Meinertzhagen IA, Rubin GM, Hess HF, Jain V, Plaza SM. A connectome and analysis of the adult Drosophila central brain. eLife. 2020;9:e57443. doi.org/10.7554/eLife.57443
- Schindelin J, Arganda-Carreras I, Frise E, Kaynig V, Longair M, Pietzsch T, Preibisch S, Rueden C, Saalfeld S, Schmid B, Tinevez J-Y, White DJ, Hartenstein V, Eliceiri K, Tomancak P, Cardona A. Fiji: an open-source platform for biological-image analysis. Nature Methods. 2012;9:676–682. doi.org/10.1038/nmeth.2019
- Schrödel T, Prevedel R, Aumayr K, Zimmer M, Vaziri A. Brain-wide 3D imaging of neuronal activity in Caenorhabditis elegans with sculpted light. Nature Methods. 2013;10:1013–1020. doi.org/10.1038/nmeth.2637
- Schwartz ML, Jorgensen EM. Saptrap, a toolkit for high-throughput CRISPR/Cas9 gene modification in Caenorhabditis elegans. Genetics. 2016;202:1277–1288. doi.org/10.1534/genetics.115.184275
- Seggewisse A, Winding M. Mapping the fly nerve cord. eLife. 2024;13:e99804. doi.org/10.7554/eLife.99804
- Serrano-Saiz E, Poole RJ, Felton T, Zhang F, De La Cruz ED, Hobert O. Modular control of glutamatergic neuronal identity in C. elegans by distinct homeodomain proteins. Cell. 2013;155:659–673. doi.org/10.1016/j.cell.2013.09.052
- Serrano-Saiz E, Pereira L, Gendrel M, Aghayeva U, Bhattacharya A, Howell K, Garcia LR, Hobert O. A Neurotransmitter atlas of the Caenorhabditis elegans male nervous system reveals sexually dimorphic neurotransmitter usage. Genetics. 2017;206:1251–1269. doi.org/10.1534/genetics.117.202127
- Seydoux G, Fire A. Soma-germline asymmetry in the distributions of embryonic RNAs in Caenorhabditis elegans. Development. 1994;120:2823–2834. doi.org/10.1242/dev.120.10.2823
- Silm K, Yang J, Marcott PF, Asensio CS, Eriksen J, Guthrie DA, Newman AH, Ford CP, Edwards RH. Synaptic vesicle recycling pathway determines neurotransmitter content and release properties. Neuron. 2019;102:786–800. doi.org/10.1016/j.neuron.2019.03.031
- Sitko AA, Frank MM, Romero GE, Hunt M, Goodrich LV. Lateral olivocochlear neurons modulate cochlear responses to noise exposure. PNAS. 2025;122:e2404558122. doi.org/10.1073/pnas.2404558122
- Südhof TC. The cell biology of synapse formation. The Journal of Cell Biology. 2021;220:e202103052. doi.org/10.1083/jcb.202103052
- Sulston JE, Horvitz HR. Post-embryonic cell lineages of the nematode, Caenorhabditis elegans. Developmental Biology. 1977;56:110–156. doi.org/10.1016/0012-1606(77)90158-0
- Sulston JE, Schierenberg E, White JG, Thomson JN. The embryonic cell lineage of the nematode Caenorhabditis elegans. Developmental Biology. 1983;100:64–119. doi.org/10.1016/0012-1606(83)90201-4
- Taylor SR, Santpere G, Weinreb A, Barrett A, Reilly MB, Xu C, Varol E, Oikonomou P, Glenwinkel L, McWhirter R, Poff A, Basavaraju M, Rafi I, Yemini E, Cook SJ, Abrams A, Vidal B, Cros C, Tavazoie S, Sestan N, Hammarlund M, Hobert O, Miller DM. Molecular topography of an entire nervous system. Cell. 2021;184:4329–4347. doi.org/10.1016/j.cell.2021.06.023
- Thomas M. Cuentas-condori-et-al.-2025-toolkit- swh:1:rev:8b71ffc4137699fbdeae8afcca5dbca69fa532bcSoftware Heritage. 2025https://archive.softwareheritage.org/swh:1:dir:d8436af73c1c5195668825e73ec41a759ff73de0;origin=https://github.com/colonramoslab/Cuentas-Condori-et-al.-2025-Toolkit-;visit=swh:1:snp:030d8f10762b632c26476d92192a2b2f85795ff7;anchor=swh:1:rev:8b71ffc4137699fbdeae8afcca5dbca69fa532bc
- Trudeau L-E, El Mestikawy S. Glutamate cotransmission in cholinergic, GABAergic and monoamine systems: contrasts and commonalities. Frontiers in Neural Circuits. 2018;12:113. doi.org/10.3389/fncir.2018.00113
- Uchida O, Nakano H, Koga M, Ohshima Y. The C. elegans che-1 gene encodes a zinc finger transcription factor required for specification of the ASE chemosensory neurons. Development. 2003;130:1215–1224. doi.org/10.1242/dev.00341
- Vaaga CE, Borisovska M, Westbrook GL. Dual-transmitter neurons: functional implications of co-release and co-transmission. Current Opinion in Neurobiology. 2014;29:25–32. doi.org/10.1016/j.conb.2014.04.010
- Wang C, Vidal B, Sural S, Loer C, Aguilar GR, Merritt DM, Toker IA, Vogt MC, Cros CC, Hobert O. A neurotransmitter atlas of C. elegans males and hermaphrodites. eLife. 2024;13:RP95402. doi.org/10.7554/eLife.95402
- Ward S. Chemotaxis by the nematode Caenorhabditis elegans: identification of attractants and analysis of the response by use of mutants. PNAS. 1973;70:817–821. doi.org/10.1073/pnas.70.3.817
- White JG, Southgate E, Thomson JN, Brenner S. The structure of the nervous system of the nematode Caenorhabditis elegans. Philosophical Transactions of the Royal Society of London. Series B, Biological Sciences. 1986;314:1–340. doi.org/10.1098/rstb.1986.0056
- Wu JS, Yi E, Manca M, Javaid H, Lauer AM, Glowatzki E. Sound exposure dynamically induces dopamine synthesis in cholinergic LOC efferents for feedback to auditory nerve fibers. eLife. 2020;9:e52419. doi.org/10.7554/eLife.52419
- Wu X, Hammer JA. ZEISS airyscan: optimizing usage for fast, gentle, super-resolution imaging. Methods in Molecular Biology. 2021;2304:111–130. doi.org/10.1007/978-1-0716-1402-0_5
- Yi Y, Li Y, Zhang S, Men Y, Wang Y, Jing D, Ding J, Zhu Q, Chen Z, Chen X, Li J-L, Wang Y, Wang J, Peng H, Zhang L, Luo W, Feng JQ, He Y, Ge W-P, Zhao H. Mapping of individual sensory nerve axons from digits to spinal cord with the transparent embedding solvent system. Cell Research. 2024;34:124–139. doi.org/10.1038/s41422-023-00867-3
- Yu CY, Chang HC. Glutamate signaling mediates C. elegans behavioral plasticity to pathogens. iScience. 2022;25:103919. doi.org/10.1016/j.isci.2022.103919
- Taylor SR, Santpere G, Weinreb A, Barrett A, Reilly MB, Xu C, Varol E, Oikonomou P, Glenwinkel L, McWhirter R, Poff A, Basavaraju M, Rafi I, Yemini E, Cook SJ, Abrams A, Vidal B, Cros C, Tavazoie S, Sestan N, Hammarlund M, Hobert O, Miller DM. 2019. Molecular topography of an entire nervous system. NCBI Gene Expression Omnibus. GSE136049
Republished from the open web under CC-BY. Authors: Cuentas-Condori A, Chanabá-López P, Thomas M, Feng L, Wolfe A, Agoba P, Schwartz ML, Brown M, Ebert MS, Jorgensen E, Bargmann CI, Colón-Ramos DA. Read the original.